
AQL sampling tables are the backbone of any structured product inspection program. Per ISO 2859-1:2026, the Acceptable Quality Limit (AQL) defines the maximum defect percentage that is still considered acceptable in a production lot, and the sampling tables translate that threshold into two concrete decisions: how many units to pull from a lot, and how many defects trigger rejection. Every inspection starts with these tables.
Here is what the AQL sampling framework delivers in practice:
- Lot size to sample size: Table 1 maps your lot size and inspection level to a code letter (A through R), which Table 2 then converts into a specific sample size.
- Acceptance and rejection numbers: Table 2 provides the Ac (accept) and Re (reject) numbers for each AQL level, so your team knows exactly when to pass or fail a lot.
- Defect class separation: Critical, major, and minor defects each carry their own AQL threshold, so a single inspection plan covers all three risk levels simultaneously.
- Inspection level flexibility: Normal, tightened, and reduced inspection levels let you scale sampling intensity up or down based on supplier history.
The standard governing all of this is ISO 2859-1:2026, which provides single, double, and multiple sampling plans for inspection by attributes. In the United States, the equivalent is ANSI/ASQ Z1.4, and the two are functionally aligned.
How to read and use the AQL sampling tables
The AQL sampling table system works in two steps, and skipping either one produces the wrong sample size or the wrong acceptance criteria. Both tables must be used together.

Step 1: Find your sample size code letter (Table 1)
Table 1 cross-references your lot size against your chosen inspection level. The result is a single code letter from A to R. General Inspection Level II is the industry default for most product inspections. Level I reduces sample size when inspection costs are high or risk is low; Level III increases it when tighter control is needed. Special levels S-1 through S-4 apply to destructive or costly tests where pulling a full sample is impractical.
| Lot size range | General Level I | General Level II | General Level III |
|---|---|---|---|
| 2–5 | A | A | B |
| 6–13 | A | B | C |
| 14–25 | B | C | D |
| 26–50 | C | D | E |
| 51–90 | C | E | F |
| 91–150 | D | F | G |
| 151–280 | E | G | H |
| 281–500 | F | H | J |
| 501–1,200 | G | J | K |
| 1,201–3,200 | H | K | L |
| 3,201–10,000 | J | L | M |
| 10,001–35,000 | K | M | N |
| 35,001–150,000 | L | N | P |
| 150,001–500,000 | M | P | Q |
| 500,001 and over | N | Q | R |
For example, a lot of 281–500 units at Normal Inspection Level II yields code letter H, which corresponds to a sample size of 50 units.
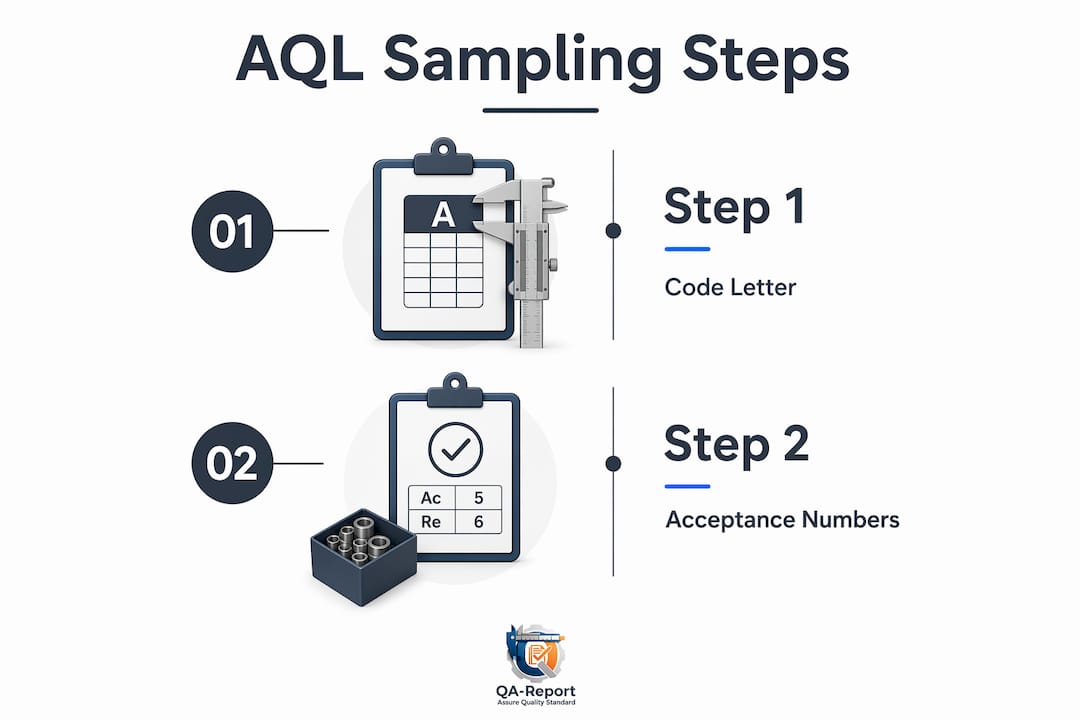
Step 2: Map the code letter to acceptance numbers (Table 2)
Once you have the code letter, Table 2 gives you the sample size and the Ac/Re pair for each AQL level. A lot is accepted when the number of defects found is at or below Ac, and rejected when defects reach or exceed Re. The two numbers are always consecutive integers (e.g., Ac = 3, Re = 4), so there is no gray zone.
- Locate your code letter in the left column of Table 2.
- Read across to the AQL column that matches your defect class (e.g., AQL 2.5 for major defects).
- Note the Ac and Re numbers in that cell.
- If the cell shows a downward arrow, move to the next larger sample size code; an upward arrow means use the next smaller one.
- Record the sample size, Ac, and Re on your inspection plan before pulling units.
Pro Tip: Never round down your sample size. If Table 2 calls for 50 units, inspect exactly 50. Pulling 45 because it is faster invalidates the statistical basis of the entire plan.
How defect types determine your AQL settings
Defect classification drives AQL selection more than any other factor. The three standard categories carry very different risk tolerances, and mixing them up is one of the most common errors in production inspection.
- Critical defects pose a safety hazard or violate a mandatory regulation. Examples include a sharp edge on a children's toy, a mislabeled pharmaceutical dosage, or a structural failure in an aerospace fastener. Critical defects typically mandate immediate lot rejection regardless of AQL calculations, because no acceptable defect rate exists for a safety risk.
- Major defects affect product function or are likely to cause customer rejection. A garment with a broken zipper, an electronic component with a missing solder joint, or a machined part outside its dimensional tolerance all qualify. The most commonly used AQL level for major defects is 2.5, meaning a 2.5% defect rate is the threshold at 95% confidence.
- Minor defects are cosmetic or functional issues unlikely to affect use. Slight color variation, a small surface scratch, or a minor label misalignment fall here. AQL levels for minor defects are commonly set at 4.0 to allow for cosmetic variations, with settings adjusted based on product standards and quality expectations.
AQL levels range from 0.065 to 6.5 across the standard tables. Stricter levels like 0.1 allow only 0.1% defective units in a lot, which is appropriate for medical devices or precision aerospace components. The practical convention most quality teams follow is: 0 or 0.065 for critical, 2.5 for major, and 4.0 for minor.
How to choose the right AQL level for your inspection
Selecting an AQL level is a risk decision, not a lookup exercise. The table tells you what sample size and acceptance number correspond to a given AQL, but it cannot tell you which AQL is right for your product. That judgment belongs to your quality team.
The key factors to weigh:
- Product criticality and end use: A medical implant and a decorative packaging insert do not share the same risk profile. Higher stakes demand tighter AQL levels.
- Defect history with the supplier: If a supplier has shipped three consecutive clean lots, reduced inspection is defensible. A recent escape or corrective action warrants tightened inspection.
- Cost of a field failure: When a defective unit reaching the customer triggers a recall, warranty claim, or regulatory action, the cost of over-inspection is trivial by comparison.
- Customer contractual requirements: Some buyers specify AQL levels in their purchase orders. Those requirements override internal defaults.
On inspection level switching: normal inspection is the starting point for most new supplier relationships. Tightened inspection activates when a defined number of consecutive lots fail under normal inspection. Reduced inspection becomes available after a sustained run of accepted lots under normal conditions, and it cuts sample size while maintaining the same AQL threshold. Switching rules in ANSI/ASQ Z1.4 govern these transitions systematically, so the decision is not discretionary once the criteria are met.
Pro Tip: Never copy AQL settings from another brand's specification without reviewing your own defect risk profile. What works for a competitor's product may leave your customers exposed or saddle your team with unnecessary inspection volume.
For teams evaluating manufacturing quality control software options, AQL configurability is one of the first features worth checking.
What ISO 2859-1:2026 changes and what best practices look like now
ISO 2859-1:2026 is the current governing standard for attributes-based acceptance sampling, superseding earlier editions while retaining the core AQL framework. It covers single, double, and multiple sampling plans, and its scope extends beyond finished goods to include sub-assemblies, materials in process, maintenance operations, and administrative records.
The most consequential best practice the standard reinforces is inspection independence. Factory-conducted inspections often under-report defects because the factory has a direct incentive to pass its own lots. Third-party or buyer-side inspectors remove that conflict and produce more reliable sampling results. For any high-stakes lot, independent inspection is the professional standard.
Switching rules deserve equal attention. Moving from normal to tightened inspection after consecutive failures, and back to normal after a recovery run, is not optional under ANSI/ASQ Z1.4. Teams that ignore switching rules and stay on normal inspection indefinitely are accepting more risk than their AQL level implies. Conversely, teams that never move to reduced inspection when a supplier earns it are paying for sample sizes they do not need.
One area where practitioners frequently stumble is the distinction between attribute and variable sampling. ANSI/ASQ Z1.4 governs attribute inspection (pass/fail), while ANSI/ASQ Z1.9 governs variable inspection (measured values). AQL tables apply directly to attribute data. When your inspection involves dimensional measurements on a normally distributed process, Z1.9 may allow a smaller sample size for the same statistical protection. Knowing which standard applies to your inspection type is foundational, and the two are not interchangeable. For teams comparing attribute and variable sampling methods in a broader SPC context, the distinction has direct implications for sample planning.
For manufacturers working with stainless steel components and material standards, applying the correct inspection level under ISO 2859-1:2026 is especially relevant given the tight tolerances involved.
Key Takeaways
Correct application of the AQL sampling table requires using Table 1 and Table 2 together, setting defect-specific AQL levels, and following ISO 2859-1:2026 switching rules to keep inspection intensity matched to actual supplier performance.
| Point | Details |
|---|---|
| Use both tables together | Table 1 gives the code letter; Table 2 converts it to sample size and Ac/Re numbers. |
| Match AQL to defect severity | Use 0 or 0.065 for critical, 1.0 or 2.5 for major, and 4.0 for minor defects. |
| Apply switching rules | Move to tightened or reduced inspection based on supplier history, not preference. |
| Require independent inspection | Third-party inspectors reduce bias and produce more reliable lot acceptance decisions. |
| QA-Report automates the math | QA-Report calculates sample sizes and Ac/Re numbers per ISO 2859-1:2026 and generates audit-ready inspection reports. |
Why AQL sampling is a risk tool, not a quality guarantee
The most persistent misunderstanding in AQL sampling is treating a passed lot as a clean lot. An AQL of 2.5 does not mean the accepted lot contains fewer than 2.5% defective units. It means the sampling plan was designed to accept lots at that defect rate with a defined statistical confidence. A lot with 3% defectives can still pass an AQL 2.5 inspection if the sample happens to draw fewer defective units than the Ac threshold. That is not a flaw in the method. It is the inherent nature of sampling.
The practical implication is that AQL sampling works as a system over time, not as a guarantee on any single lot. When switching rules are followed, when inspection is independent, and when AQL levels are calibrated to actual defect consequences, the system catches quality problems at the supplier level before they reach your customer. When any of those conditions breaks down, the statistical protection erodes.
A second underappreciated point: the difference between attribute sampling under ANSI/ASQ Z1.4 and variable sampling under ANSI/ASQ Z1.9 is not just procedural. Variable sampling can achieve the same statistical protection with a smaller sample when the underlying measurement data is normally distributed. Quality teams that default to attribute sampling for every inspection type are often over-inspecting. Reviewing which method fits each inspection characteristic is worth the effort, particularly for high-volume production runs.
Finally, AQL levels should be revisited periodically. A supplier who has shipped clean product for two years may warrant a lower inspection intensity than your original plan specified. A supplier who recently had an escape should not be on reduced inspection regardless of what the switching rules technically allow. Judgment and data together produce better outcomes than either one alone.
QA-Report puts AQL calculations where your inspectors actually work
Calculating sample sizes from printed tables, transcribing Ac/Re numbers into spreadsheets, and manually tracking switching rule status across dozens of active suppliers adds hours of administrative work to every inspection cycle. QA-Report eliminates that overhead.

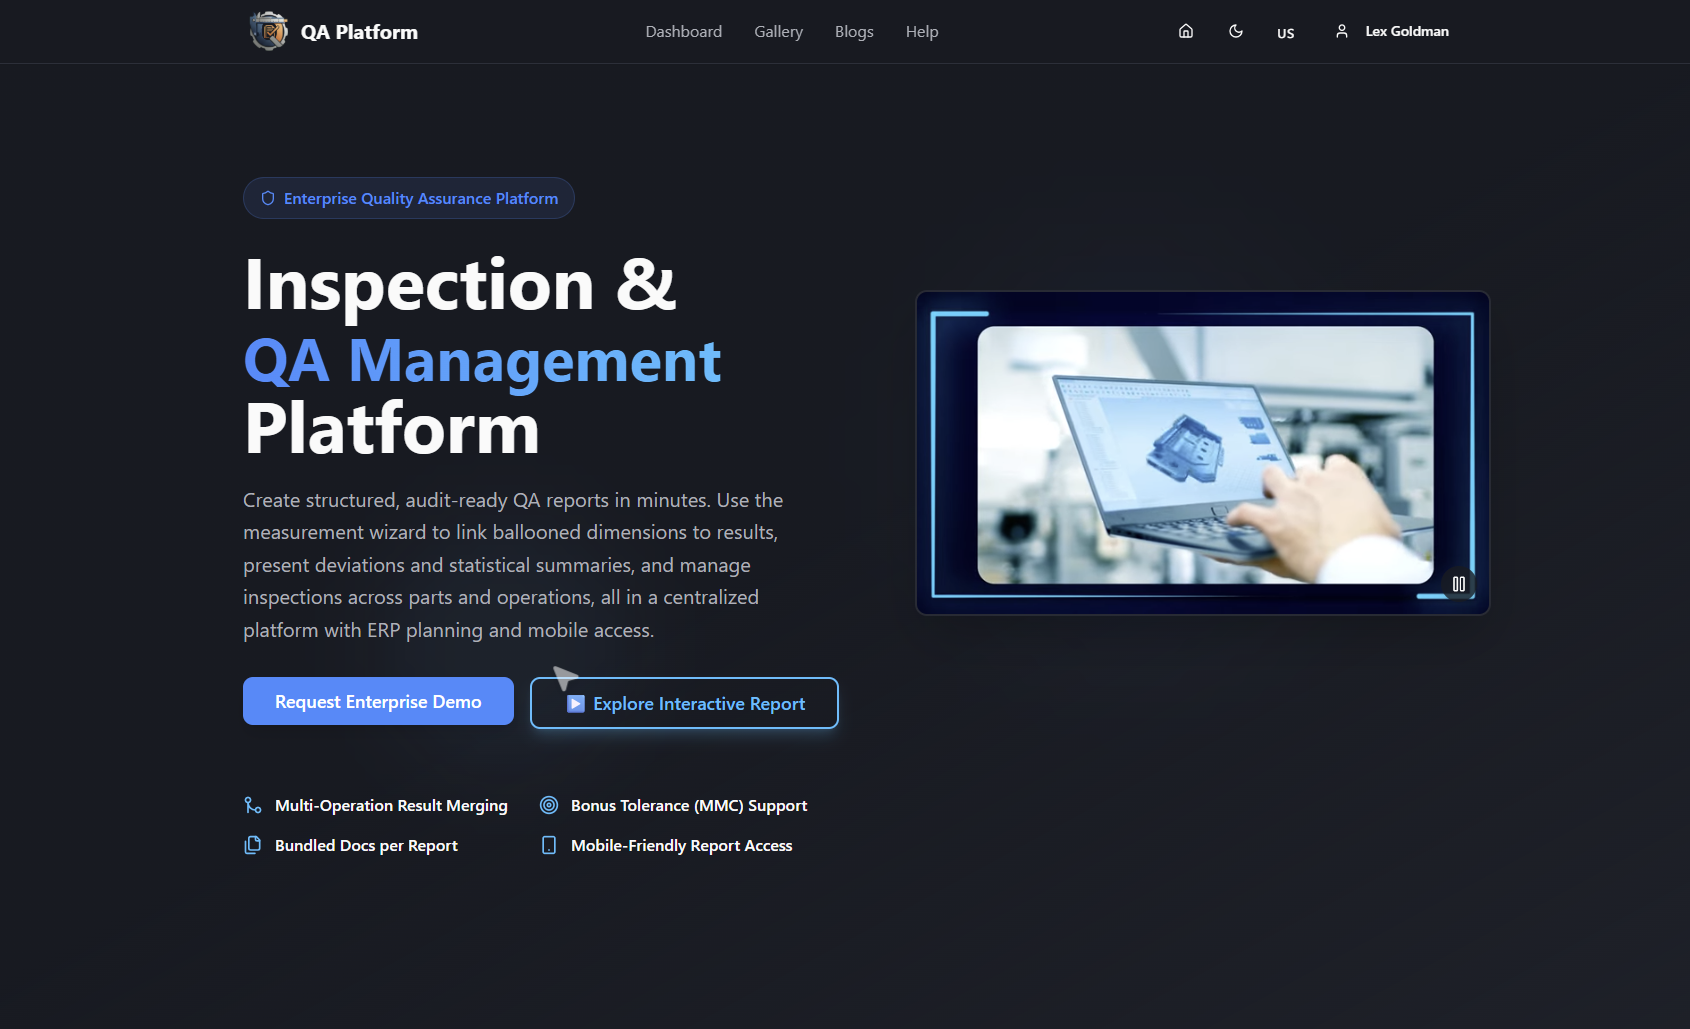
The platform automates sample size and acceptance number calculations directly from ISO 2859-1:2026, supports normal, tightened, and reduced inspection levels with built-in switching rule logic, and generates audit-ready PDF inspection reports that satisfy ISO 9001, AS9100, and PPAP requirements. Defect tracking, lot disposition records, and CMM data import are all centralized in one cloud-based system with mobile access for inspectors on the floor. Your team spends time inspecting, not doing table lookups.
Start with QA-Report and see how much faster a structured AQL inspection program runs when the math is handled for you.