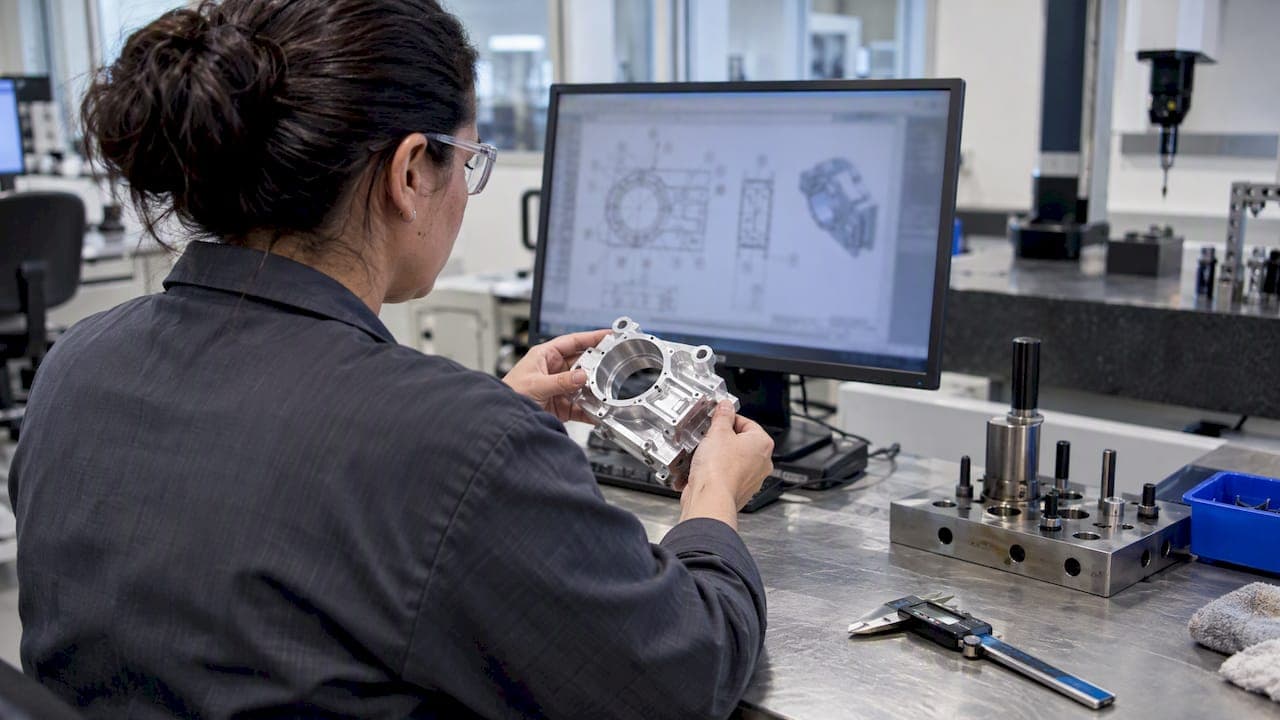
Drawing dimensions auto detection pairs automatic ballooning with measurement linking, turning a marked-up drawing into an audit-ready FAI or dimensional report without manual transcription. The output must still satisfy AS9102 and ASME Y14.5 acceptance rules, and the detection models behind it, while accurate, are not infallible. We built QA-Report around this exact workflow, so this guide lays out how it works and how to verify it.
TL;DR:
- Automated detection accuracy for numerical dimensions is around 0.963 F1 score, but human verification remains essential, especially for faint or overlapping details.
- Reliable identification depends on linking balloons to characteristics, not just revision-dependent numbers, to maintain traceability across multiple releases.
- Handling missing tolerances involves prioritizing feature tables or default values, with PMI data from CAD being more accurate than presentation-only annotations.
- Failures often result from low scan resolution, dense GD&T, or ambiguous mappings, requiring specific fixes such as higher DPI, model tuning, or manual validation.
- Validation protocols should include comprehensive testing with representative drawings, accuracy benchmarks, and revalidation triggers like design changes or drawing revisions.
Table of Contents
- How detection pipelines read and parse engineering drawings
- Matching detected dimensions to measured results and tolerances
- Making auto-ballooned drawings AS9102-ready before submission
- Where auto detection breaks and how to fix it quickly
- Running a validation protocol before trusting results in production
- What we've learned rolling this out across drawing families
- How QA-Report puts auto detection to work on your drawings
- FAQ
- Sources
How detection pipelines read and parse engineering drawings
Most production-grade pipelines follow the same basic sequence. Layout segmentation separates the title block, feature control frames, and dimension zones first, since treating a drawing as one flat image produces weak results. An oriented annotation detector, often a YOLO-style model with rotated bounding boxes, then locates each dimension regardless of its angle on the sheet. A vision-language model or OCR engine parses the localized text, and the pipeline emits structured output, typically JSON, that downstream software can consume directly.
This hybrid approach outperforms generic OCR because engineering drawings break the assumptions OCR was built on: text runs vertically, dimensions nest inside leader lines, and GD&T symbols are not alphanumeric characters at all. Standard OCR assumes left-to-right reading order, which is why orientation-aware detection and context-aware parsing are necessary rather than optional.
- Layout segmentation isolates information blocks, feature control frames, and dimension pipelines before parsing begins.
- Oriented detectors locate rotated or stacked dimensions that flat bounding boxes miss.
- Vision-language parsing converts localized annotations into structured numeric and tolerance fields.
- Semantic PMI from STEP or AP242 files, when available, bypasses 2D parsing and feeds tolerances directly.
A recent multi-stage hybrid framework reported numerical parsing accuracy with an F1 score of approximately 0.963, while alphabetical field extraction (notes, callouts) lagged at roughly 0.672, underscoring why numeric dimensions are far more reliable to automate than free-text annotations (vision-language model study). Errors still cluster around faint strokes, overlapping leader lines, and densely annotated views, which is exactly where an inspector's visual check earns its keep.
Matching detected dimensions to measured results and tolerances
Auto-ballooning only pays off if each balloon carries a stable identifier that survives revisions. A balloon number tied to a coordinate on the page breaks the moment a drawing is reissued, while a balloon number tied to a characteristic definition keeps pointing to the correct feature and populates AS9102 Form 3 cleanly release after release.
Matching detected dimensions to measured values relies on a few repeatable rules rather than guesswork:
- Spatial clustering groups a dimension value with its tolerance and symbol by proximity, then checks view association to confirm it belongs to the correct projection.
- Annotation parsing extracts the nominal, upper limit, and lower limit as separate fields rather than one text blob.
- When a tolerance is missing from the dimension itself, the engine falls back to a feature table, then a title block default, in that order.
- When semantic PMI exists in the CAD source, it takes precedence over any parsed 2D value, since PMI data reduces manual interpretation errors compared with presentation-only drawings.
- Coordinate-based features (true position, profile) are compared as vectors, not single scalars, so a CMM report and a drawing dimension line up correctly.
Every measured result also needs its uncertainty stated, not just a pass or fail flag. NIST guidance on expressing measurement uncertainty calls for reporting the combined standard uncertainty, written as u, alongside an expanded uncertainty U, calculated as U = k·u, where k is the coverage factor. Recording both U and k with every measured value gives an auditor the confidence basis behind a conformance call rather than a bare number. Integration from a CMM report, whether imported directly or entered from a CMM export file, should preserve this uncertainty data rather than stripping it down to a single measured figure.
Making auto-ballooned drawings AS9102-ready before submission
Automated ballooning speeds up the mechanical work, but AS9102 FAQs state that automated inspection outputs may be attached to Form 3 only when characteristic numbers are clearly linked to design characteristics and results are directly comparable. That linkage is a planning requirement, not an afterthought.
- Identify every design characteristic on the drawing and confirm all of them, not a sample, carry a balloon before measurement begins.
- Define the inspection sequence and select measurement equipment appropriate to each characteristic's tolerance band.
- Set an uncertainty and acceptance policy up front, including how U and k will be recorded for each reported value.
- Attach calibration IDs, drawing revision, and operator identification to every result so the FAIR package is traceable end to end.
Before any automated package goes out the door, run a short set of pre-acceptance checks: spot-verify a sample of ballooned dimensions against the drawing by eye, apply a confidence threshold so low-confidence detections route to manual review, and document corrective action whenever a flagged item required a fix, following established powder coating quality and testing standards. Planning is the stage where objective evidence either becomes traceable or doesn't, so treat these checks as part of planning, not cleanup afterward.
Pro Tip: Keep a drawing revision log tied to your balloon map, since a new revision can silently shift characteristic numbers and break traceability if the mapping isn't refreshed.

Where auto detection breaks and how to fix it quickly
Most detection failures trace back to one of three sources: the scan itself, the parsing model, or the mapping logic. Each has a straightforward fix.
- Low-resolution scans and inconsistent crop boxes cause missed or misread dimensions. Set a minimum scan DPI, deskew pages automatically, and standardize margins before upload.
- Rotated text and dense GD&T clusters confuse generic detectors. Use a model tuned to the symbol set your drawings actually contain, and add representative training examples from your own drawing families rather than relying on a generic dataset.
- Ambiguous mappings, where a value could belong to either of two nearby balloons, should widen the clustering radius cautiously and then force manual verification rather than guessing.
- Low-confidence detections deserve a conservative default: route them to a fail or review state instead of letting a borderline pass slip through.
Process controls matter as much as model tuning. Require inspector sign-off above a defined risk threshold, keep drawing baselines versioned so a reissued drawing doesn't silently invalidate an old balloon map, and roll out automation one drawing family at a time rather than across the whole shop floor at once. For a deeper troubleshooting walkthrough, see 5 auto dimension detection failures and fixes.
Pro Tip: Pilot automated ballooning on your highest-volume, most stable drawing family first. A family with consistent formatting surfaces fewer edge cases while you build confidence in the output.
Running a validation protocol before trusting results in production
Before any automated detection pipeline earns a place in a compliance workflow, it needs a validation run with recorded metrics, not a one-off demo.
- Build a test set of representative drawings plus deliberate edge cases: dense GD&T, rotated text, multi-view sheets.
- Run detection and mapping across the full set and log detection recall, numeric extraction character error rate, mapping accuracy, and tolerance-match rate for every drawing.
- Compare results against acceptance thresholds, for example detection recall at or above 95% on the baseline set and mapping accuracy at or above 98% for critical characteristics, and hold back anything that misses.
- Define revalidation triggers: a drawing revision, a CAD source change, or a shift in production process should all re-trigger this protocol.
- Archive the validation report, a sample of annotated images, and the metric log together so an auditor can trace exactly what was validated and when.
A published segmented pipeline reported recall and precision close to 90% for dimension detection, with low character error rates for recognition (eDOCr study), a reasonable baseline to benchmark your own validation run against before committing to production use.
What we've learned rolling this out across drawing families
The teams that get the most value automate their highest-volume, most consistently formatted drawing families first and keep human review on anything safety-critical or ambiguous. Trying to automate every drawing type on day one usually backfires, since the edge cases eat the time savings. A hybrid rollout, where routine dimensions flow through automatically and flagged items route to an inspector, tends to outperform an all-or-nothing approach by a wide margin. For more on how the transition from manual markup typically unfolds, see drawing ballooning from manual markup to AI detection.
— Michael Chen
How QA-Report puts auto detection to work on your drawings
We built this platform to take the manual transcription out of FAI and dimensional inspection without asking you to trust a black box. Automatic drawing ballooning numbers characteristics, a measurement wizard links each balloon to its measured result, CMM import brings coordinate data in directly, and tolerance validation auto-flags out-of-tolerance deviations as soon as data lands.
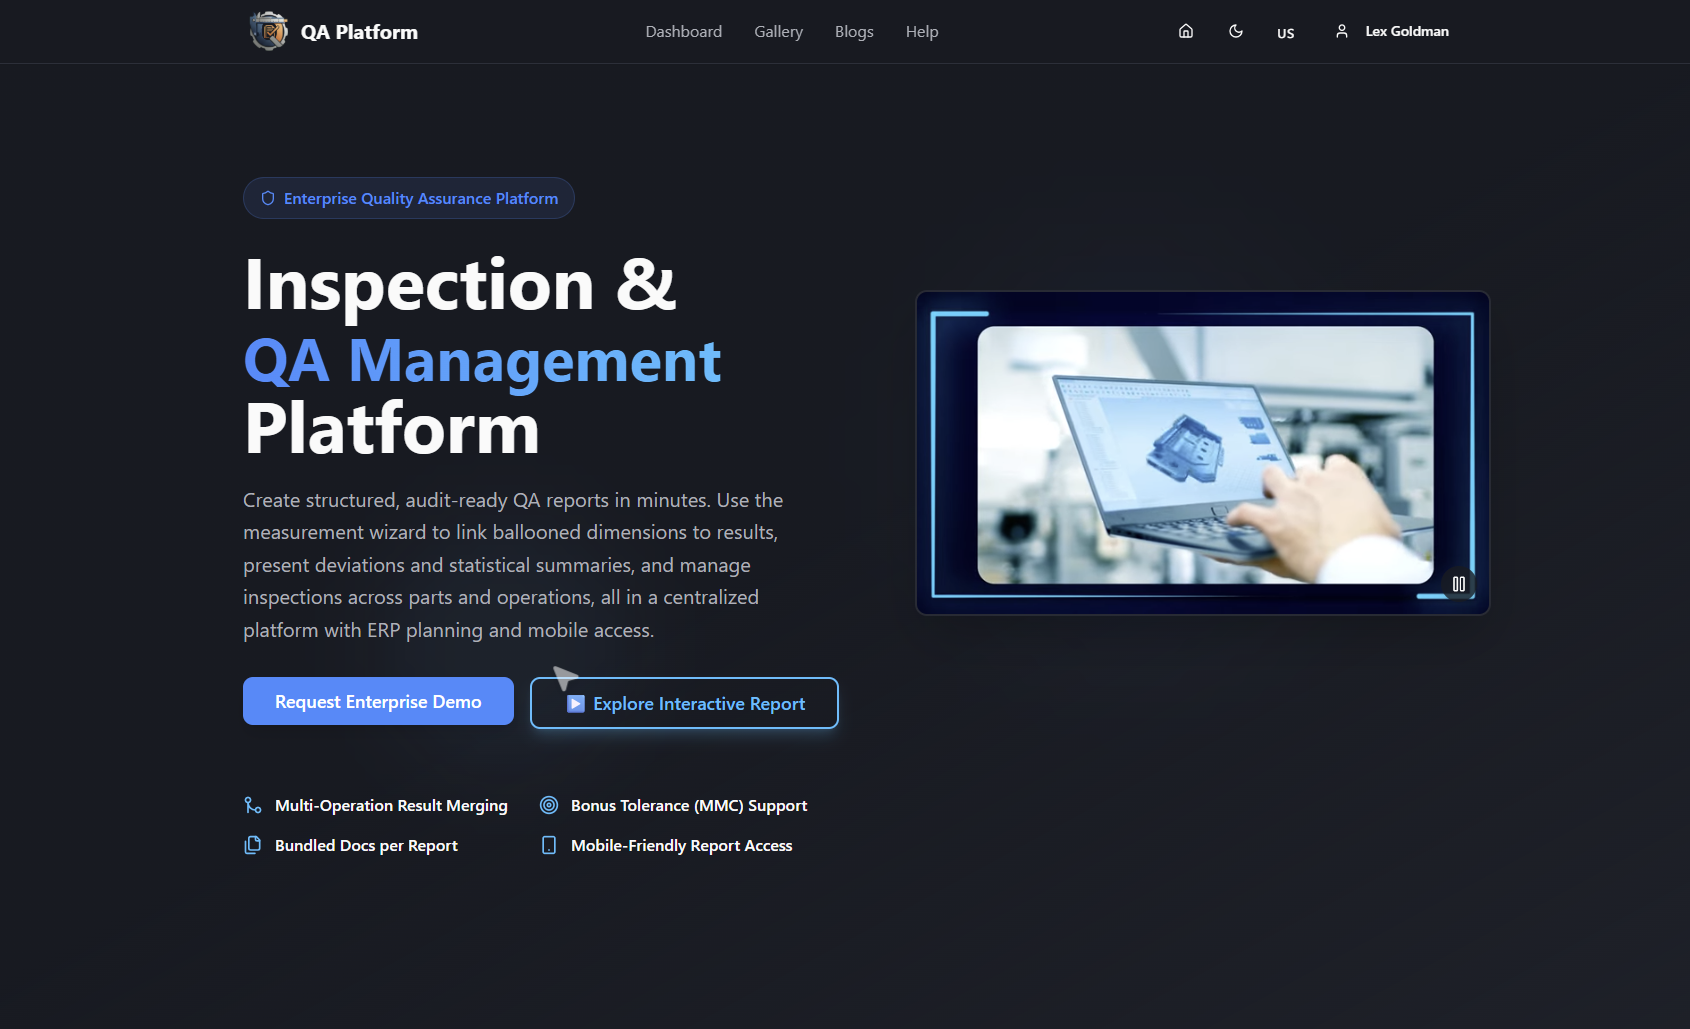
- Automatic drawing ballooning with AI auto-numbering removes hours of manual markup per drawing.
- CMM data import keeps coordinate and scalar comparisons aligned without hand re-entry.
- Tolerance validation and out-of-tolerance flagging happen automatically as results come in.
- Reports are generated in formats aligned with ISO 9001, AS9100, and PPAP requirements.
You can try the free drawing ballooning tool on one of your own drawings first, or compare the Free, Basic, PRO, On-Premise, and Enterprise plans to see which fits your inspection volume before running a pilot.
FAQ
What is drawing dimensions auto detection used for?
It automatically locates and parses dimensions on engineering drawings, then links each one to a measured result for FAI and dimensional inspection reporting. The goal is to replace manual transcription with a traceable, ballooned mapping that supports AS9102 and ASME Y14.5 acceptance requirements.
How accurate is automated dimension detection?
Published results vary by approach, but a hybrid vision and language model pipeline reported numerical parsing accuracy with an F1 score near 0.963, while a separate segmented pipeline reported detection recall and precision near 90%. Neither figure replaces verification, so a sample review and confidence thresholding remain part of any acceptable workflow.
Can automated ballooning outputs go directly into an AS9102 report?
Yes, when characteristic numbers are clearly linked to design characteristics and results are directly comparable, AS9102 guidance allows automated inspection outputs to be attached to Form 3. Traceability, not the automation itself, is what the standard checks for.
Does QA-Report support CMM data import for mapping measured results?
Yes, QA-Report imports CMM data directly and aligns it to ballooned drawing characteristics through the measurement wizard, as described on the CMM inspection software page. This keeps coordinate-based and scalar dimension comparisons consistent without manual re-entry.
What should I do when a detected dimension looks wrong?
Route it to manual review rather than accepting or rejecting it automatically, since ambiguous mappings and low-confidence detections are exactly where human verification earns its value. Check scan quality, drawing revision, and whether the tolerance came from the dimension itself or a fallback source before correcting it.
Sources
- A Multi-Stage Hybrid Framework for Automated Interpretation of Multi-View Engineering Drawings Using Vision Language Model
- eDOCr: automated interpretation of engineering drawings (Frontiers in Manufacturing Technology)
- AS9102: First Article Inspection - FAQ