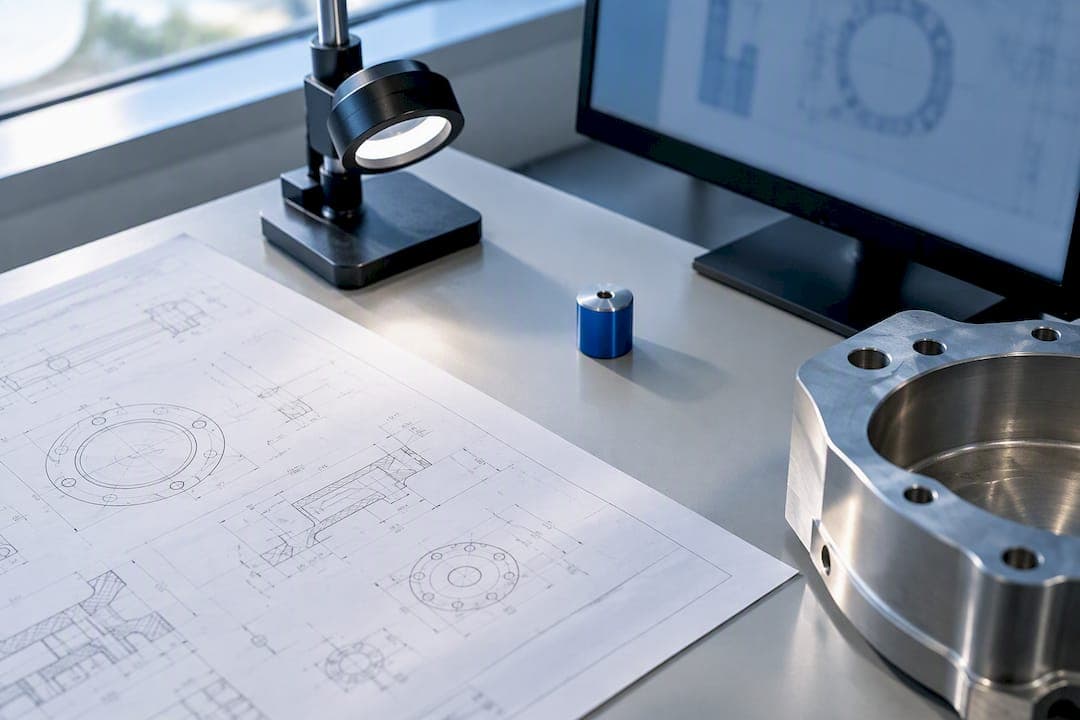
Automatic GD&T extraction reads feature control frames, datum references, and tolerance values directly from a drawing, then structures that data with a record of exactly where each symbol sits on the sheet. The output feeds inspection reports, CMM programs, and MES records without a technician re-keying a single dimension. For quality teams, the practical payoff is straightforward: staff stop transcribing and start reviewing exceptions. This platform is built around that shift.
TL;DR:
- Automated GD&T extraction can accurately capture feature control frames, datum references, and tolerance callouts, including their relationships and exact locations on drawings.
- The process maps measured CMM results directly to extracted callouts, enabling automatic out-of-tolerance alerts and reducing manual re-entry in inspection and reporting workflows.
- Extraction performance diminishes with poor-quality scans or complex, ambiguous symbols, so pilots must include your worst drawings to gauge real-world reliability.
- Security and proprietary data sensitivity are critical; cloud platforms should specify encryption, access controls, and data retention policies before processing sensitive drawings.
Table of Contents
- What Does Automatic GD&T Extraction Actually Capture?
- How Does Automated GD&T Analysis Actually Work?
- What Do You Actually Save, and Where Does Automation Fall Short?
- How Do You Roll Out GD&T Extraction Software Without Disrupting Inspection?
- What Should You Ask When Evaluating GD&T Extraction Tools?
- How Secure Is Your Engineering Data During Extraction?
- What Pilots Get Wrong About Automated Drawing Extraction
- Try Automatic GD&T Extraction Without Rebuilding Your Inspection Process
- Sources
- FAQ
What Does Automatic GD&T Extraction Actually Capture?
Automated tolerance extraction pulls far more than a list of numbers off a drawing. A mature system reads the full annotation set on a sheet and preserves the relationships between symbols, not just their values.
Expect extraction to return:
- Feature control frames — the tolerance symbol, value, modifiers, and datum letters in one grouped unit
- Datum references — the reference letters and their associated datum feature symbols
- Tolerance callouts — linear, angular, and geometric values tied to specific dimensions
- Surface finish requirements and general notes that qualify how a feature is inspected
- Hole tables and title block metadata — part number, revision, material, and drawing scale
This is what people mean by symbol grammar: understanding that a feature control frame refers to a specific datum, which refers to a specific feature, which carries its own tolerance zone. An extraction engine that only reads text loses that chain. One that parses grammar can catch an invalid combination, like a profile tolerance referencing a datum that does not exist on the sheet, the same way a senior engineer would catch it on a second read.
Every extracted field also carries provenance: a bounding polygon that marks where on the drawing that value came from, so a reviewer can click a JSON field and land on the exact symbol. Systems that support GD&T extraction and compliance tracking build this traceability in by design, and it's what separates an auditable extraction from a black-box guess. Output typically arrives as JSON with field-level evidence, CSV or Excel for FAIR sheets, or through an API or webhook for direct ERP and PLM ingestion.
How Does Automated GD&T Analysis Actually Work?
The pipeline behind automated GD&T analysis runs in stages. A PDF, DXF, or scanned drawing first gets parsed for layout and text; then a vision model isolates GD&T symbols and their geometry; then a grammar layer links each symbol back to its datum and feature; the result is structured PMI (product manufacturing information) output ready for review.
That second stage is where accuracy lives or dies. General-purpose vision models trained on broad image sets tend to misread stacked tolerance frames or confuse similar-looking datum letters. Models fine-tuned specifically for engineering drawings perform measurably better.
The numbers behind the claim: Research on fine-tuning vision-language models for engineering drawings found that specialized models produced a 52.40% improvement in F1-score and a 43.15% reduction in hallucination rates on GD&T extraction tasks, compared with general-purpose closed models. That gap is the difference between a tool you can trust on a first article inspection and one that needs a human to check every line.
Confidence scores make that trust operational. Each extracted field gets a score, and drawings or fields that fall below a set threshold get routed to a review queue instead of flowing straight into a report. Practically, this looks like:
- High-confidence fields (feature control frames on clean, machine-generated drawings) auto-populate the inspection plan
- Mid-confidence fields (handwritten notes, worn scans) get flagged for a reviewer with the bounding box highlighted
- Low-confidence or unrecognized symbols get rejected outright rather than guessed
When a CMM run comes back, the measured results map to the same extracted callouts by feature ID, which is what lets a platform generate an out-of-tolerance flag and a statistical summary automatically instead of by hand.
What Do You Actually Save, and Where Does Automation Fall Short?
The time savings show up first in first article inspection and quoting. Instead of an engineer manually ballooning a drawing and transcribing forty dimensions into a spreadsheet, extraction handles the transcription and the engineer checks the flagged exceptions. Vendor benchmarks for provisioned extraction tiers report processing times in the 5 to 20 second range per page, though that figure varies with drawing complexity and image quality, so treat it as a directional signal rather than a guarantee for every drawing set.
The workflows with the clearest return are:
- Drawing-to-quote — junior estimators can prepare a quote from extracted tolerances while an engineer reviews only the flagged items
- First article inspection (FAI) — ballooned dimensions map straight into an AS9102 or PPAP-style report
- CMM report automation — measured values reconcile against extracted nominal and tolerance values without manual matching
- BOM and ERP feeds — part attributes and revision data flow downstream without re-entry
Limitations are real and worth naming honestly. Poor-quality scans, hand-marked redline notes, and uncommon or composite symbol combinations still trip up even well-trained models. Ambiguous feature control frames, where a human reader has to infer intent from context, remain a weak spot across the industry.
Pro Tip: When you pilot an extraction tool, deliberately include your worst drawings, not just your cleanest ones. A tool that scores well only on pristine CAD-exported PDFs will disappoint you the moment a supplier sends a scanned redline.
Operationally, watch for sample bias in pilot testing, budget reviewer time for the exception queue rather than assuming zero-touch processing, and update your inspection SOPs so auditors understand where automated extraction sits in the traceability chain.
How Do You Roll Out GD&T Extraction Software Without Disrupting Inspection?
A phased rollout keeps risk low and gives you real data before you commit budget.
- Baseline your current process. Pick 20 to 30 representative drawings, including a few ugly ones, and time your team's manual ballooning and transcription work today.
- Run a short pilot. Set confidence thresholds, define what triggers a review gate, and assign someone to own the exception queue.
- Map fields to downstream systems. Connect extracted tolerance values to your CMM inspection columns and your ERP or PLM part records so data flows in one direction without duplicate entry.
- Check 3D compatibility. If your workflow relies on a STEP or IGES viewer alongside 2D drawings, confirm the extraction platform supports both.
- Train reviewers and update SOPs. Document what an inspector checks versus what the software auto-populates, and keep that split auditable.
- Instrument your KPIs. Track the percentage of extracted PMI consumed without manual correction, hours saved per report, and any audit findings tied to extraction errors.
- Scale in phases. Expand from one part family or one production line to the full shop, and schedule periodic accuracy re-checks as drawing standards or suppliers change.
Before committing to a paid platform, testing extraction against your own drawings costs nothing. QA-Report's free drawing ballooning tool lets a team run this exact validation step against real CMM and CNC inspection workflows.
- Keep a log of every field that required manual correction during the pilot
- Compare confidence scores against actual reviewer overrides to calibrate your threshold
- Revisit thresholds quarterly as your drawing mix changes
What Should You Ask When Evaluating GD&T Extraction Tools?
Judging automated tolerance extraction fairly means asking for numbers, not marketing language. A serious evaluation checklist looks like this:
- Accuracy metrics: request F1-score specifically on feature control frame extraction, plus precision and recall broken out for datum references and tolerance values separately
- Field-level evidence: confirm the platform returns bounding polygon coordinates and the original symbol image alongside every extracted value, not just a clean number with no trace back to the source
- Integration depth: verify CMM import support, STEP/IGES viewer compatibility, API or webhook delivery, and CSV/Excel export formatted for FAIR sheets
- Compliance-ready outputs: check that generated reports map to FAI templates and satisfy ISO 9001, AS9100, or PPAP documentation requirements out of the box
- Deployment and security options: ask whether cloud and on-premise deployment are both available, whether access controls are role-based for shop-floor inspectors, and whether inspectors get usable mobile access
Any vendor unwilling to share accuracy metrics broken down by symbol type, rather than one blended number, is asking you to trust a black box with your audit trail.
How Secure Is Your Engineering Data During Extraction?
Engineering drawings carry some of the most sensitive intellectual property a manufacturer owns: tolerances that reveal process capability, datum strategies that reflect years of design refinement, and part geometry tied directly to customer programs. Handing that data to an extraction platform without asking about security is a real exposure, not a theoretical one.
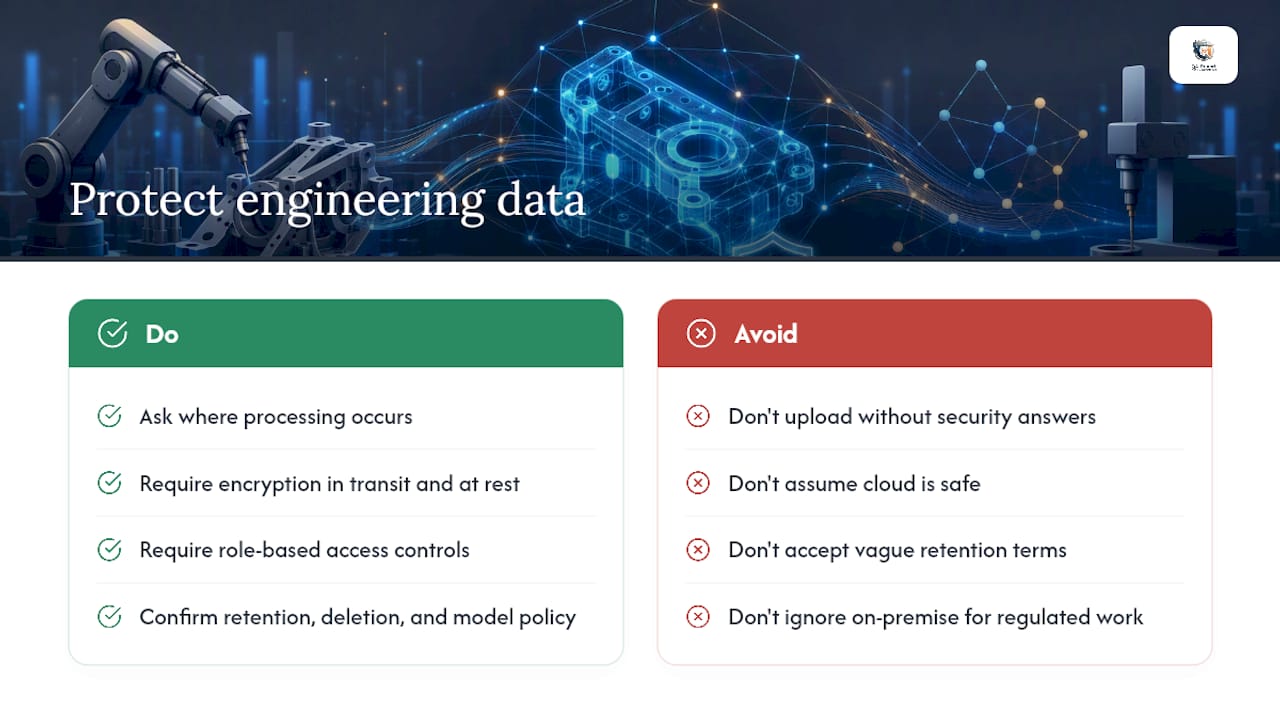
The core questions to settle before you upload a single drawing: where does processing happen, who can access the extracted data, and what happens to the file after extraction completes. Cloud-based platforms should specify encryption in transit and at rest, and role-based access controls that limit who on the shop floor or in engineering can view a given part family. For aerospace, defense, and medical device work, on-premise deployment removes the question entirely by keeping drawings inside your own network boundary rather than a vendor's cloud, which is why platforms serving those industries typically offer both options.
Retention policy matters as much as access control. Ask how long a vendor keeps your drawing files after processing, whether extracted data gets used to train shared models across customers, and whether you can request deletion on demand. A vendor that cannot answer these questions specifically, or that treats them as an afterthought, is telling you something about how seriously they take the data you are about to send them.
What Pilots Get Wrong About Automated Drawing Extraction
Most failed pilots share the same root cause: teams test extraction on their cleanest drawings and declare victory. Real production drawing sets include hand-marked redlines, scanned legacy prints, and composite tolerance frames that a narrow pilot never touches. Sample your worst drawings before you sample your best ones, or the accuracy numbers you present to leadership will collapse the moment production volume hits.
The second mistake is turning off evidence traceability to speed up review. It's tempting to trust a high confidence score and skip the bounding box check, but that habit erodes the audit trail regulated industries depend on. The real return on investment shows up when senior engineers stop re-keying dimensions and spend their time on the flagged exceptions instead, which only works if the exception queue is trustworthy.
Run pilots with explicit pass or fail criteria set before you start, not after you see the results, and train reviewers on the tool's confidence thresholds from day one.
— Michael Chen
Try Automatic GD&T Extraction Without Rebuilding Your Inspection Process
This software is built for the exact workflow this article walks through: extract, verify, report, without adding a second system to manage. The measurement wizard links ballooned drawing dimensions to measured results and auto-flags out-of-tolerance deviations, so the confidence-threshold and review-gate approach described above runs inside one platform instead of three disconnected tools.
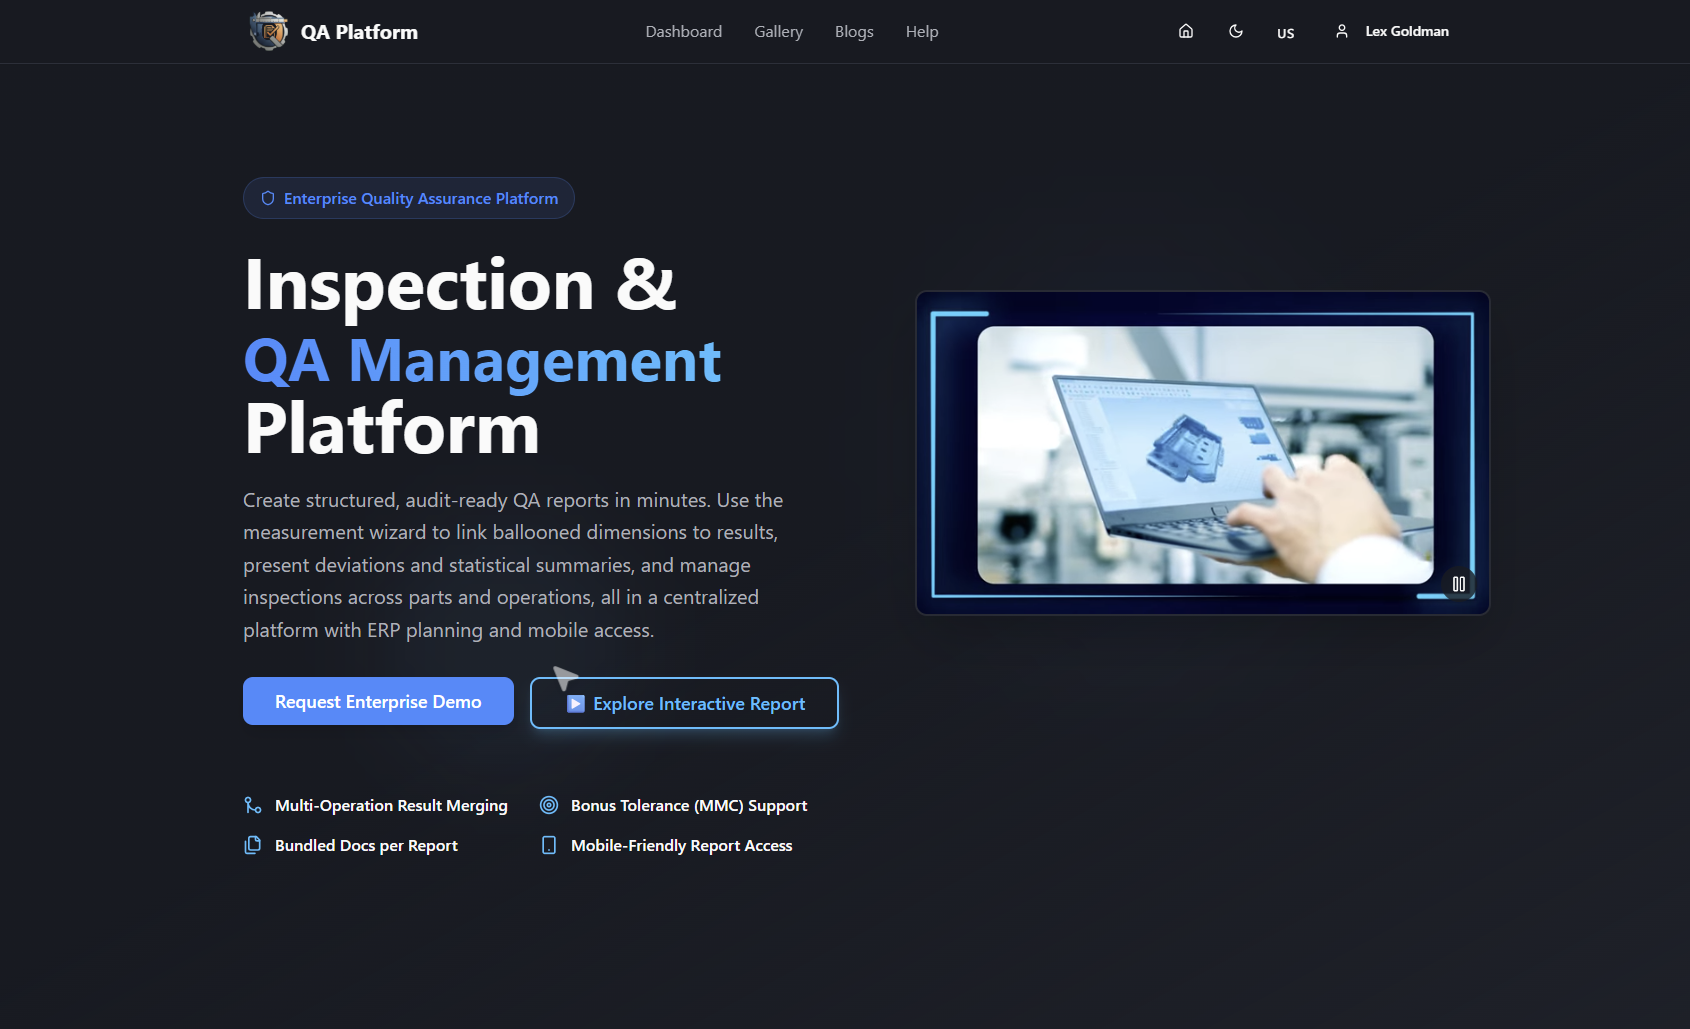
Automatic drawing ballooning removes the manual numbering step entirely, and the built-in 3D CAD viewer handles STEP and IGES files alongside your 2D drawings. CMM data import maps measured values straight to extracted tolerance callouts, generating statistical summaries and PDF reports that satisfy ISO 9001, AS9100, and PPAP requirements without a separate export step. Cloud and on-premise deployment are both available, which matters if your program requires data confidentiality that a pure cloud tool can't guarantee.
Test the extraction and ballooning workflow against your own drawings first with the free drawing ballooning tool. When you are ready for full FAI reporting and MES planning, Basic starts at $49.99 a month and PRO at $149.99 a month, with on-premise and enterprise pricing available on request.
FAQ
What Does Automatic GD&T Extraction Software Actually Extract?
It extracts feature control frames, datum references, tolerance values, surface finish notes, and hole table data, each linked back to its exact location on the drawing. That location link, often stored as a bounding polygon, is what lets a reviewer verify a value instead of trusting it blindly.
How Accurate Is Automated GD&T Feature Recognition?
Accuracy varies by model and drawing quality, but specialized models built for engineering drawings substantially outperform general-purpose vision models. One fine-tuning study found a 52.40% F1-score improvement and a 43.15% drop in hallucination rates for specialized models versus general-purpose ones.
Can Extracted GD&T Data Feed Directly Into a CMM Report?
Yes. Extracted tolerance callouts map to CMM measurement columns by feature ID, so measured results reconcile against nominal values automatically. QA-Report's CMM inspection software builds statistical summaries and out-of-tolerance flags from that mapping without manual matching.
What Does QA-Report Cost for Automated Inspection Reporting?
QA-Report offers a Free plan, a Basic plan at $49.99 per month, and a PRO plan at $149.99 per month, with On-Premise and Enterprise pricing available on request. Full details are on the pricing page.
What Are the Biggest Limitations of Automatic Tolerance Extraction?
Poor-quality scans, hand-marked redline notes, and uncommon or composite symbol combinations remain the hardest cases for any extraction system. That's why confidence thresholds and human review gates stay part of the workflow rather than a temporary crutch.