
Cpk and Ppk share the same formula structure but differ in exactly one place: the sigma estimator. Cpk uses within-subgroup sigma (short-term variation only), while Ppk uses the overall sample standard deviation (all variation, including shifts and drifts between subgroups). That single difference determines everything about when to use each index. The practical recommendation: compute both every time. Report Ppk for customer-facing performance data and use Cpk when qualifying a new process or diagnosing short-term capability. When Cpk and Ppk are close in value, your process is stable. When they diverge significantly, that gap is itself a diagnostic finding worth investigating before you report anything to a customer.
Key Takeaways
Cpk and Ppk differ only in their sigma estimator: compute both, compare them, and always document which one you are reporting and why.
| Point | Details |
|---|---|
| Sigma estimator is the only difference | Cpk uses within-subgroup sigma; Ppk uses overall sample standard deviation. |
| Stable process means close values | When Cpk and Ppk are close, the process is stable and either index is valid for reporting. |
| Large gap signals instability | A substantial Cpk/Ppk divergence indicates between-subgroup shifts or drifts that need investigation. |
| Threshold context matters | 1.33 is the common production minimum; 1.67 is required for critical characteristics in many industries. |
| QA-Report automates the reporting | QA-Report generates Cpk/Ppk summaries with documented sample windows in audit-ready PDF format. |
Table of Contents
- What is the difference between Cpk and Ppk?
- Why rational subgrouping shapes your Cpk value
- Two numeric examples that show when Cpk and Ppk agree and when they don't
- When should you use Cpk vs Ppk?
- How to interpret Cpk and Ppk thresholds and act on them
- What to check when Cpk and Ppk diverge significantly
- How to calculate Cpk and Ppk step by step
- Common misconceptions about Cpk and Ppk
- A practitioner's perspective on choosing the right index
- QA-Report makes audit-ready capability reporting faster
- Sources
What is the difference between Cpk and Ppk?
Both indices measure how well a process fits within its specification limits relative to its natural variation. The formulas are nearly identical, and understanding where they split apart is the foundation of the entire cpk vs ppk comparison.
Core formulas
For Cpk, you calculate two one-sided indices and take the minimum:
- Cpu = (USL − x̄) / (3σ̂within)
- Cpl = (x̄ − LSL) / (3σ̂within)
- Cpk = min(Cpu, Cpl)
For Ppk, the structure is identical but the denominator changes:
- Ppu = (USL − x̄) / (3σ̂overall)
- Ppl = (x̄ − LSL) / (3σ̂overall)
- Ppk = min(Ppu, Ppl)
Where:
- USL = upper specification limit
- LSL = lower specification limit
- x̄ = process mean
- σ̂within = within-subgroup sigma estimate (derived from control-chart logic, e.g., R̄/d₂ or S̄/c₄)
- σ̂overall = overall sample standard deviation (s = √[Σ(xᵢ − x̄)² / (n−1)])
The Minitab Blog states this directly: the only mathematical difference between Cpk and Ppk is the estimator of sigma. Cpk uses within-subgroup sigma; Ppk uses the overall sample standard deviation. Everything else in the formula is the same.
What "capability" vs "performance" actually means
Cpk answers: What could this process achieve if it stayed exactly as it is right now, subgroup to subgroup? Ppk answers: What has this process actually delivered across the full data window, including any shifts and drifts? As Analyse-it explains, confusing capability with performance is one of the most common mistakes in process reporting. Cpk describes potential; Ppk describes reality.
Why rational subgrouping shapes your Cpk value
The within-subgroup sigma in Cpk is only meaningful if your subgroups are designed rationally. A rational subgroup captures parts produced under essentially the same conditions: same setup, same operator, same short time window. When subgroups are constructed that way, the within-subgroup range or standard deviation reflects only inherent process noise, not shifts between setups or lots.
Control charts are the mechanism that connects subgrouping to Cpk. An X̄-R or X̄-S chart uses the same within-subgroup sigma estimate that feeds into Cpk. If the chart shows the process is in statistical control (no special causes), then Cpk is a valid measure of short-term capability. If the chart shows out-of-control signals, the within-subgroup sigma is still mathematically calculable, but the Cpk value no longer represents a stable process. JMP's process capability guidance reinforces this: examine both indices alongside control charts to diagnose stability, not just the index values in isolation.
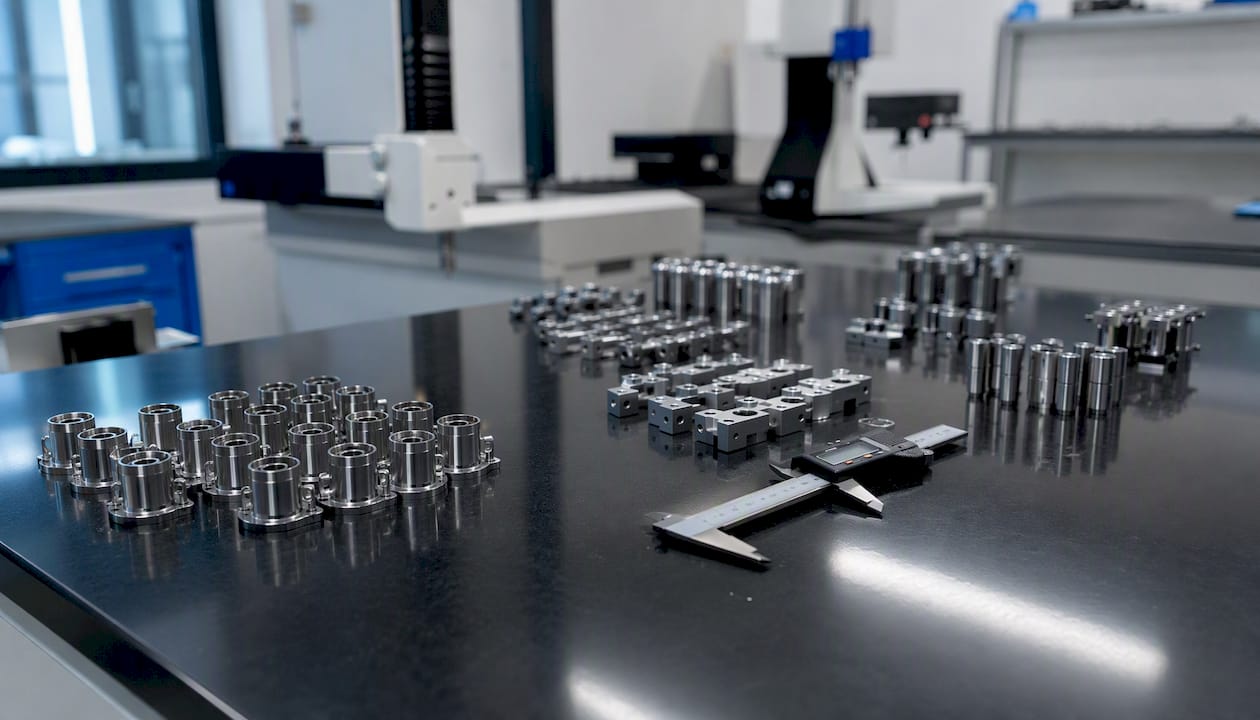
Practical sampling choices that affect Cpk include subgroup size (typically 4–5 for X̄-R charts), the time interval between subgroups, and whether parts from different lots or cavities are mixed into a single subgroup. Mixing lots inflates within-subgroup variation artificially and produces a Cpk that understates short-term capability. For SPC in machining environments, consistent subgroup timing and source separation are especially critical because tool wear and fixture variation can introduce between-subgroup shifts that should be visible on the control chart, not buried in the within estimate.
Pro Tip: Never mix parts from different cavities, spindles, or setups into a single subgroup. Each source of variation should be subgrouped separately so that the within estimate reflects only the noise of that single source. Blending them produces a Cpk that is neither short-term nor long-term — it is simply misleading.
Two numeric examples that show when Cpk and Ppk agree and when they don't
These examples use symbolic but reproducible numbers. Specification limits are USL = 10.50 and LSL = 9.50 (tolerance = 1.00), with a target mean of 10.00.
Example A: stable process
| Parameter | Value |
|---|---|
| Mean (x̄) | 10.02 |
| Within-subgroup sigma (σ̂within) | 0.080 |
| Overall sigma (σ̂overall) | 0.083 |
| Cpk | 1.57 |
| Ppk | 1.51 |
Cpk = min((10.50 − 10.02)/(3 × 0.080), (10.02 − 9.50)/(3 × 0.080)) = min(2.00, 2.17) = 1.57
Ppk = min((10.50 − 10.02)/(3 × 0.083), (10.02 − 9.50)/(3 × 0.083)) = min(1.93, 2.09) = 1.51
The two values are close (difference < 0.10). ASTM's analysis of Cpk vs. Ppk confirms that when a process is stable, Cpk and Ppk should be practically equal. This process is stable, well-centered, and exceeds the 1.33 threshold comfortably.
Example B: drifting or unstable process
Cpk = min((10.50 − 10.05)/(3 × 0.075), (10.05 − 9.50)/(3 × 0.075)) = min(2.00, 2.44) = 1.69
Ppk = min((10.50 − 10.05)/(3 × 0.140), (10.05 − 9.50)/(3 × 0.140)) = min(1.07, 1.31) = 0.90
The gap here is large. Cpk looks excellent; Ppk falls below 1.00. The University of Waterloo capability analysis paper shows exactly this pattern: Ppk appears lower because the overall sigma captures between-subgroup variation that the within estimate misses. Reporting only Cpk to a customer in this scenario would be misleading.
What each scenario signals:
- Cpk ≈ Ppk: the process is stable; either index is valid, but Ppk is the customer-facing number.
- Cpk much higher than Ppk: between-subgroup shifts or drifts are present; investigate before reporting.
- Ppk higher than Cpk: rare, but possible with very small subgroup sizes where the within estimate is inflated; check subgroup design.
When should you use Cpk vs Ppk?
The choice is not about which index is "better." It is about what question you are answering and who is reading the result.
Use Cpk when:
- Qualifying a new process during a PPAP submission or initial capability study, where you want to know what the process can do under controlled, short-term conditions.
- Running a designed experiment or process improvement study where you are holding conditions constant and measuring inherent variation.
- Diagnosing whether a process has the fundamental capability to meet specifications, separate from any long-term drift.
- Comparing machine-to-machine or setup-to-setup performance within a controlled window.
Use Ppk when:
- Reporting ongoing production performance to a customer or in a control plan review.
- Measuring long-term process health across multiple lots, shifts, or time periods.
- Submitting data for customer scorecards, supplier audits, or regulatory submissions where actual delivered performance is required.
- Evaluating whether a process has maintained its capability over a production run, not just at qualification.
Always state which sigma estimator you used and the data window it covers. A Cpk of 1.45 from a 30-piece short-term study and a Ppk of 1.45 from six months of production data are very different claims. Experienced practitioners apply Cpk for process qualification and Ppk for long-term performance monitoring, and they document that distinction explicitly in every report.
Common industry practice treats certain threshold values as minimums for production and critical characteristics, but specific numeric values depend on customer or standard requirements and should always be confirmed. Always confirm the threshold your customer or standard requires before reporting.
How to interpret Cpk and Ppk thresholds and act on them
Threshold values are not arbitrary. They map directly to the proportion of output expected to fall within specification, assuming a normal distribution and a centered process.
| Index value | Interpretation | Recommended action |
|---|---|---|
| < 1.00 | Process is not capable; defects are being produced | Stop and investigate immediately; do not ship without sorting or containment |
| 1.00–1.33 | Marginally capable; risk of defects with any shift | Tighten process controls; increase inspection frequency; target improvement |
| 1.33–1.67 | Acceptable for most production characteristics | Maintain controls; monitor with control charts; document sampling window |
| > 1.67 | Capable for critical or safety characteristics | Sustain with periodic audits; consider reducing inspection frequency |
Industry practice, referenced by SixSigma.us, treats 1.33 as the common minimum for production acceptance and 1.67 as the threshold for critical characteristics. Some aerospace and medical customers require 1.67 as the baseline for all features, so confirm requirements before interpreting results.
A caution on near-threshold values: a Ppk of 1.34 from a 30-piece sample is not meaningfully different from 1.30. Confidence intervals for capability indices are wide at small sample sizes. Near-threshold results should be treated as provisional until confirmed with larger samples or sustained production data.
- For Ppk or Cpk below 1.33: contain first, then investigate root cause before resuming normal production.
- For values between 1.33 and 1.67: document the result, set a review date, and track the control chart for early warning signals.
- For values above 1.67: the process is performing well, but do not remove monitoring entirely; capability can erode silently without ongoing measurement.
What to check when Cpk and Ppk diverge significantly
A large gap between the two indices is not a calculation error. It is a signal. ASTM's guidance on this point is direct: the gap indicates process instability caused by between-subgroup variability, and it warrants investigation before any capability number is reported to a customer.
Work through these checks in order:
1. Confirm data integrity Verify that the data set is complete, time-ordered, and free of transcription errors. Check for outliers that may reflect measurement errors rather than process behavior.
2. Run control charts Plot an X̄-R or X̄-S chart on the same data. Out-of-control points, trends, or shifts confirm that between-subgroup variation is real, not an artifact of the sigma formula.
3. Stratify by lot, operator, machine, or shift Split the data by each potential source of between-subgroup variation. If Ppk improves substantially within a single stratum, you have identified the source of the gap.
4. Run a Gage R&R study Measurement system error inflates overall sigma without affecting within-subgroup sigma in the same proportion. A Gage R&R study will quantify how much of the observed variation is measurement noise versus process variation.
5. Check for tool wear, setup changes, or environmental shifts These are the most common physical causes of between-subgroup drift in machining. Quality control best practices for precision manufacturing consistently identify tool wear and fixture variation as primary drivers of Cpk/Ppk divergence.

6. Recalculate after corrective action Once the root cause is addressed, recalculate both indices on clean, stable data. Document the corrective action and the new data window.
Pro Tip: When reporting a large Cpk/Ppk gap to a customer, follow ASTM's guidance and state both values explicitly along with the investigation findings. Never report only Cpk when Ppk is substantially lower — that omission will surface during a customer audit and damages credibility far more than an honest capability shortfall.
How to calculate Cpk and Ppk step by step
These steps apply whether you are working in a spreadsheet or a dedicated stats package.
-
Collect and time-order your data. Record measurements in production sequence. Do not sort or filter by value. Include the subgroup identifier for each measurement.
-
Define your subgroups. Assign each measurement to a rational subgroup (typically 4–5 consecutive parts from the same setup, within a short time window). Never mix parts from different setups, cavities, or lots in one subgroup.
-
Remove non-process-related data points. Exclude measurements tied to known measurement errors, equipment malfunctions, or startup conditions that are not representative of normal production. Document every exclusion.
-
Compute within-subgroup sigma (σ̂within). Calculate the range (R) or standard deviation (s) for each subgroup. Average the ranges to get R̄, then divide by the control-chart constant d₂ for your subgroup size (d₂ = 2.059 for n = 4; d₂ = 2.326 for n = 5). Alternatively, average the subgroup standard deviations and divide by c₄. In Excel, this requires a lookup table for d₂ or c₄ by subgroup size — these constants are tabulated in any SPC reference.
-
Compute overall sigma (σ̂overall). Use Excel's
STDEVfunction on the full data set (all individual measurements). This is the sample standard deviation s. -
Calculate the process mean (x̄). Use
AVERAGEon all individual measurements. -
Apply the Cpk formula. Compute Cpu = (USL − x̄) / (3 × σ̂within) and Cpl = (x̄ − LSL) / (3 × σ̂within). Cpk =
MIN(Cpu, Cpl). -
Apply the Ppk formula. Compute Ppu = (USL − x̄) / (3 × σ̂overall) and Ppl = (x̄ − LSL) / (3 × σ̂overall). Ppk =
MIN(Ppu, Ppl). -
Compare the two values. If Cpk and Ppk are close, the process is stable. If Cpk is substantially higher than Ppk, work through the troubleshooting checklist above.
-
Document your reporting metadata. Record the sample size, data window (start and end date or lot range), subgroup size, sigma estimator used for each index, and any data exclusions. This documentation is required for APQP/PPAP submissions and customer audits.
In Minitab, the Stat > Quality Tools > Capability Analysis menu computes both indices simultaneously and displays the sigma estimator used. In JMP, the Process Capability platform does the same. For real-time SPC software in production environments, confirm that the software labels which sigma estimator it uses for each reported index.
Common misconceptions about Cpk and Ppk
Myth: Cpk is always the better metric. Neither index is universally superior. Cpk is appropriate for short-term qualification; Ppk is appropriate for long-term performance reporting. Defaulting to Cpk for all reporting understates the variation customers actually experience.
Myth: Cpk will always be higher than Ppk. This is usually true when a process has between-subgroup shifts, because overall sigma is larger than within sigma. But with very small subgroup sizes, the within-subgroup sigma estimate can be inflated by sampling noise, producing a Cpk that is lower than Ppk. Stability, not a fixed mathematical rule, determines the relationship.
Myth: a single index value proves capability. An index value without a control chart, a histogram, and a stated confidence interval is incomplete. A process can produce a Cpk of 1.40 on one run and 0.95 on the next if it is not stable. The index is a summary, not a guarantee.
Confusing reporting phrases to avoid:
- "Our Cpk is 1.45" with no sigma estimator stated: reword to "Cpk = 1.45 using within-subgroup sigma (R̄/d₂), n = 25, subgroup size = 5, data from [date range]."
- "The process is capable" based on Cpk alone: add "Process is stable per X̄-R chart; Ppk = 1.38 over the full production window."
A practitioner's perspective on choosing the right index
The most persistent problem in capability reporting is not a calculation error. It is the habit of reporting a single index without context. Quality teams under schedule pressure reach for Cpk during qualification, get a number above 1.33, and move on. The Ppk never gets calculated. Months later, a customer audit reveals that long-term performance tells a different story.
The fix is straightforward: build both calculations into your standard capability study template from day one. When Cpk and Ppk agree, you have strong evidence of stability and you can report either with confidence. When they diverge, you have found something worth investigating before a customer finds it for you. That gap is not a problem to hide; it is information.
One practical step for quality dashboards: display Cpk and Ppk side by side for every characteristic, with a third column showing the ratio or difference. A ratio approaching 1.0 signals stability. A ratio below 0.85 should trigger an automatic review flag. That single visual cue turns a passive report into an active monitoring tool.
QA-Report makes audit-ready capability reporting faster
Capability analysis is only as useful as the report it produces. Quality engineers who calculate Cpk and Ppk manually in spreadsheets often spend more time formatting and documenting than analyzing. QA-Report eliminates that overhead.

The platform imports CMM data directly, maps measurements to ballooned drawing dimensions, and generates statistical summaries that include both Cpk and Ppk with documented sample windows and sigma estimators. Reports are formatted to satisfy ISO 9001, AS9100, and PPAP requirements out of the box, with no manual assembly. Out-of-tolerance deviations are flagged automatically, and every report carries full traceability from raw measurement to final PDF.
For teams managing CMM inspection workflows, QA-Report's data import and auto-mapping removes the transcription step entirely, which is where most capability reporting errors originate. The result is an audit-ready capability report in minutes rather than hours.
Start a free trial at QA-Report and see how your team's capability reporting changes when the documentation takes care of itself.
Sources
The following references support the formulas, examples, and troubleshooting guidance throughout this article.
- Cpk vs. Ppk: Clearing Up the Confusion | ASTM
- Process Capability Statistics: Cpk vs. Ppk — Minitab Blog
- Process Capability Analysis (Steinle, UW Waterloo paper)
- Process capability | JMP Statistics Knowledge Portal
- Cp, Cpk, Pp and Ppk explained | Analyse-it