
A gage R&R study measures how much of your total measurement variability comes from the measurement system itself, specifically from the gage and the appraisers who use it. Run one before any SPC program, capability study, or supplier qualification decision. The industry-standard acceptance rule is straightforward:
- Under 10% GRR: Acceptable. The measurement system is suitable for its intended use.
- 10–30% GRR: Marginal. Evaluate based on application criticality; improvement planning is recommended.
- Over 30% GRR: Unacceptable. The system must be improved before use.
Schedule a full crossed study when introducing a new gage, onboarding a new operator team, changing a process, or before locking in a capability index. A quick mini-study (5 parts × 2 operators × 2 trials) can screen for obvious problems first, but formal reporting requires the full design.
Table of Contents
- What does a gage R&R study actually measure?
- Why measurement system variability corrupts your process data
- Crossed, nested, expanded, and attribute studies: which design fits your situation?
- How to design a valid Gage R&R study: parts, operators, trials, and randomization
- Average & Range vs. ANOVA: which analysis method should you use?
- How to interpret %GRR, %Contribution, and NDC
- Graphical diagnostics every GRR report should include
- Mapping corrective actions to the root cause of measurement error
- Worked example: crossed Gage R&R with ANOVA
- What to include in a Gage R&R report and when to re-run
- Key Takeaways
- The part of Gage R&R that most engineers underestimate
- QA-Report brings structure to your GRR data collection and reporting
- Authoritative references and further reading
What does a gage R&R study actually measure?
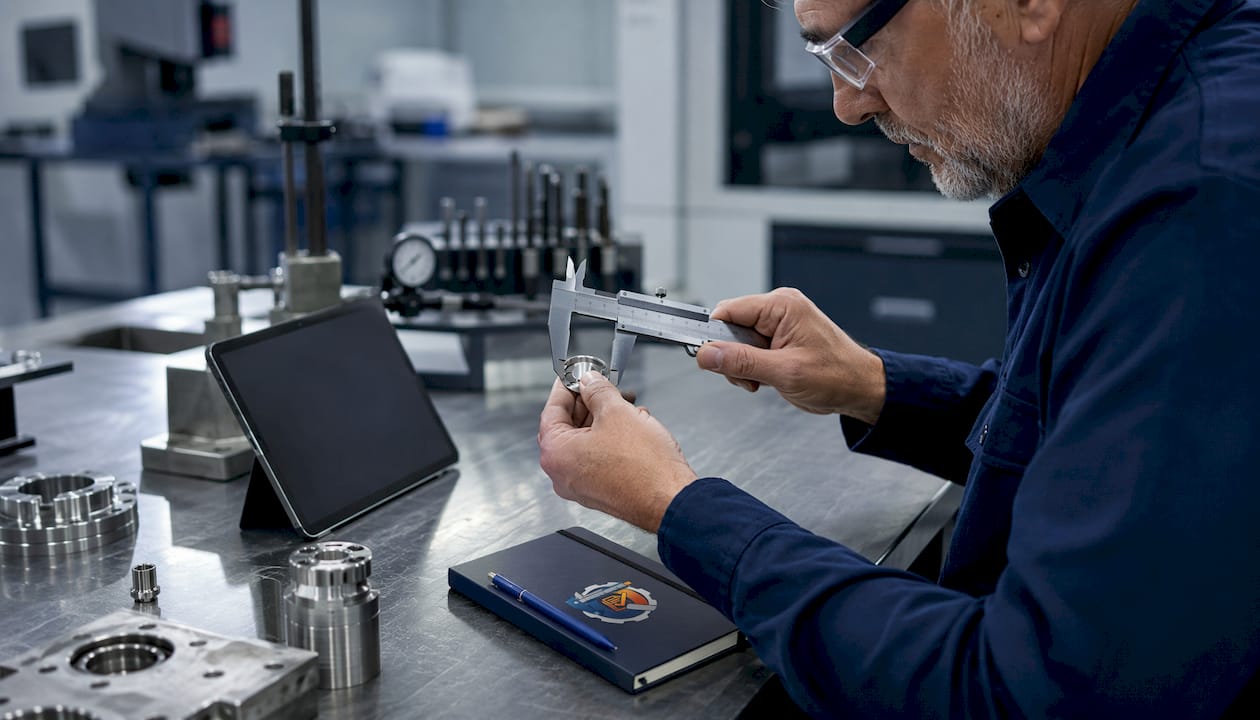
Gage R&R, short for Gage Repeatability and Reproducibility, separates measurement system variation into two distinct components. Repeatability is the variation you see when the same operator measures the same part multiple times with the same gage under identical conditions. Reproducibility is the variation that appears when different operators measure the same part. Together, they define the precision of your measurement system.
Where GR&R fits inside Measurement System Analysis (MSA) is worth understanding precisely. MSA also covers bias (systematic offset from true value), linearity (whether bias changes across the measurement range), and stability (whether the system drifts over time). A Gage R&R study addresses only the precision side of that picture. A system can pass a GRR with flying colors and still be biased, which is why bias and linearity checks are separate exercises.
Pro Tip: Before attributing poor repeatability to the gage itself, check measurement stability and environmental conditions. Temperature swings, vibration, and inconsistent part seating account for a surprising share of repeatability failures.
Why measurement system variability corrupts your process data
Every data point your team records carries two sources of variation: true process variation and measurement system variation. When the measurement system contributes a large share, SPC control charts respond to measurement noise rather than real process shifts. Control limits tighten or widen based on phantom variation, and Cpk values misrepresent actual process capability.
The practical consequences are concrete:
- False alarms on control charts: Operators chase measurement noise instead of real assignable causes.
- Wrong accept/reject decisions: Parts near the tolerance boundary get accepted or rejected based on gage error, not actual conformance.
- Misleading capability indices: A Cpk calculated from noisy data overstates or understates true process performance.
- Supplier disputes: Incoming inspection disagreements often trace back to measurement system differences between the supplier's gage and yours.
Decisions that depend on trustworthy measurements — SPC alarms, first-article acceptance, PPAP approval, and supplier scorecards — all rest on the assumption that the measurement system is validated. Without that foundation, manufacturing quality assurance programs produce conclusions that cannot be defended in an audit or a customer dispute. Run a GRR before major product launches, equipment changes, new supplier qualifications, or whenever measurement-related disagreements arise.
Crossed, nested, expanded, and attribute studies: which design fits your situation?
ASQ defines three GRR study types: crossed, nested, and expanded. Choosing correctly depends on whether the measurement is destructive, how many factors affect the system, and whether you are dealing with variable or attribute data.
- Crossed GRR: All operators measure all parts, multiple times. This is the standard design for nondestructive dimensional checks, and it is the most common choice in machined-parts environments. It supports both A&R and ANOVA analysis.
- Nested GRR: Each operator measures a different set of parts. Use this when the measurement destroys the part, such as tensile testing, pull-force testing, or hardness testing that leaves a permanent indentation. The critical assumption is that parts within each batch are homogeneous enough to be treated as equivalent.
- Expanded GRR: Adds a third factor, typically gage, fixture, or lab, to the standard two-factor design. Use it when operator and part alone do not fully characterize the measurement system, or when missing data points make a standard balanced design impractical.
- Attribute GRR: Applies to pass/fail or categorical inspection results. Instead of %GRR, the primary metric is percent agreement among operators and against a known standard. Use this for visual inspection, go/no-go gaging, or any check that produces a discrete result rather than a continuous measurement.
Pro Tip: Choose the simplest design that honestly answers the practical question. An expanded study with three factors is more informative, but it multiplies data collection effort. Start with a crossed design and escalate only when the standard outputs leave meaningful questions unanswered.
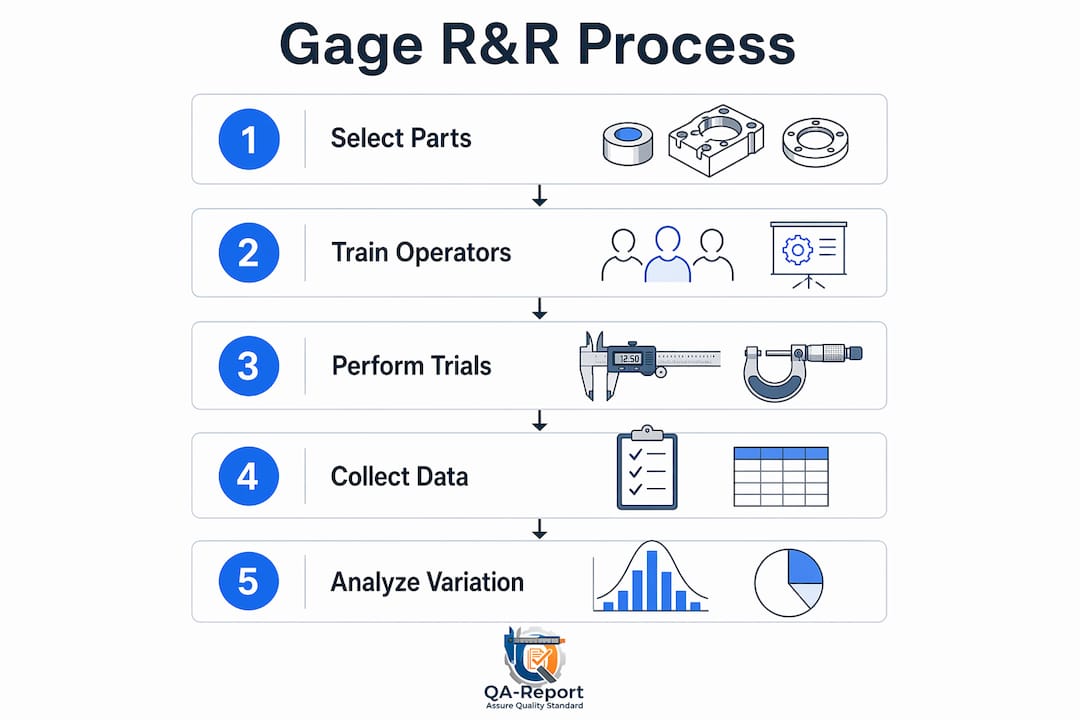
How to design a valid Gage R&R study: parts, operators, trials, and randomization
Study design is where most GRR failures originate. Poor part selection is the leading cause of invalid studies: if the parts chosen do not span the full process variation, the measured %GRR will understate measurement-system error, and the study will pass a system that should not.
Part selection:
- Select 5–10 parts that represent the full range of expected process variation, not just conforming parts near nominal.
- Include parts near both tolerance limits and at nominal to ensure the study reflects real operating conditions.
Operators:
- Use 2–3 operators who actually perform the inspection in production. Selecting operators unfamiliar with the gage inflates reproducibility artificially.
- Three operators is the standard recommendation for formal studies.
Trials:
- Each operator measures each part 2–3 times. Three trials per operator per part is the recommended design for robustness.
- Fewer trials reduce statistical power; more trials rarely change conclusions but add collection time.
Randomization:
- Randomize the measurement order within each operator's run to prevent memory bias. If an operator measures part 3 twice in a row, they may unconsciously reproduce their first reading.
- Blind the operators to each other's results during the study.
| Design | Parts | Operators | Trials | Total Readings | Typical Use |
|---|---|---|---|---|---|
| Mini-study | a small number of parts | a few operators | a few trials | total readings based on design | Quick screening, early development |
| Standard crossed | parts spanning process variation | multiple operators | multiple trials | total readings based on design | Formal MSA, PPAP, SPC readiness |
| Nested (destructive) | parts selected per study requirements | multiple operators | multiple trials | total readings based on design | Tensile, pull-force, hardness |
| Expanded (3-factor) | parts selected per study design | multiple operators | multiple trials | total readings based on design | Multi-gage or multi-fixture systems |
Pro Tip: For hardness testing or other surface-sensitive measurements, use standardized test blocks as reference samples. They eliminate part-to-part material variability from the repeatability calculation, isolating true gage performance.
Average & Range vs. ANOVA: which analysis method should you use?
Two analysis methods are in common use for GRR studies, and the choice affects both what you learn and how defensible your report is.
| Dimension | Average & Range (A&R) | ANOVA / Variance Components |
|---|---|---|
| Method of analysis | Manual calculation; Excel-friendly | Statistical software preferred (Minitab, R) |
| Study type supported | Crossed only | Crossed and nested |
| Typical sample needs | 10 parts × 2–3 operators × 2–3 trials | Same; more trials improve precision |
| Ease of execution | High; computable by hand | Moderate; requires software for full output |
| Key outputs | %GRR, %Repeatability, %Reproducibility | All A&R outputs plus variance components, operator×part interaction |
| Interaction term | Not isolated | Quantified separately |
The
is simpler and works well for quick checks or when software is unavailable. It calculates %GRR from the range of repeated measurements and the range of operator averages. The limitation is that it cannot separate the operator×part interaction from pure reproducibility error.ANOVA is the preferred method for formal reporting. It partitions total variation into parts, operators, operator×part interaction, and residual (repeatability) using a full variance-component model. The interaction term matters: when one operator consistently reads high on large parts and low on small parts while another shows the opposite pattern, A&R will average that out and miss it entirely. ANOVA surfaces it as a statistically significant interaction, which changes the corrective action.
Software accelerates ANOVA substantially. Minitab's Gage R&R module is the industry reference, and Real Statistics for Excel provides explicit formulas for engineers who need to verify calculations manually. That said, automated tools cannot substitute for a valid study design. Software will produce a clean-looking ANOVA table from a poorly designed study without warning you.
How to interpret %GRR, %Contribution, and NDC
The three primary outputs from a GRR analysis are %GRR, %Contribution, and the Number of Distinct Categories (NDC). Each tells a different part of the story.
%GRR expresses measurement system variation as a percentage of total process variation (or tolerance, depending on the calculation basis). The acceptance thresholds are:
- Under 10%: Acceptable
- 10–30%: Marginal. Evaluate based on application criticality; improvement planning is recommended.
- Over 30%: Unacceptable. The system must be improved before use.
%Contribution is the squared ratio of measurement system standard deviation to total standard deviation. It is a more conservative metric than %GRR because squaring amplifies the difference. A %GRR of 30% corresponds to roughly 9% contribution, which is why the two numbers often confuse engineers comparing reports from different sources.
NDC (Number of Distinct Categories) answers a different question: how many statistically distinct groups can the measurement system reliably distinguish within the process spread? AIAG guidance sets the minimum at 5. An NDC below 5 means the gage lacks sufficient resolution for SPC, even if %GRR looks acceptable. Treat NDC and %GRR together when deciding suitability.
Decision flow based on dominant error source:
- Repeatability dominates: Inspect the gage for wear, check calibration status, evaluate fixture stability, and assess environmental conditions (temperature, vibration).
- Reproducibility dominates: Review operator technique, standardize work instructions, add fixturing to reduce operator-to-operator positioning variation, and conduct targeted training.
- Interaction dominates: Examine whether operators are applying different measurement approaches to different part geometries. Fixture redesign or explicit measurement procedure steps often resolve this.
Pro Tip: Always pair GRR results with bias and linearity checks before finalizing any MSA conclusion. A system with 8% GRR that carries a 0.003" bias on a 0.005" tolerance is not fit for purpose, regardless of what the R&R table says.
Graphical diagnostics every GRR report should include
Plots are not decoration. Each standard GRR graphic reveals a specific failure mode that the numerical summary can obscure.
- X̄ (average) chart by operator: Shows whether operator averages differ systematically. Operators whose averages fall outside the control limits are contributing reproducibility error.
- Range (R) chart by operator: Highlights repeatability consistency. Points outside control limits on the R chart indicate an operator with inconsistent technique or a gage that behaves differently in different hands.
- Operator × part interaction plot: The most diagnostic graphic in the set. Parallel lines indicate no interaction; crossing or diverging lines reveal that operator bias depends on which part is being measured. This pattern demands investigation before corrective action.
- Parts boxplot (by part): Shows whether selected parts actually span process variation. If all boxes cluster near nominal, the study underrepresents the process spread and %GRR will be understated.
- Residual plot and histogram/QQ plot: Check the normality assumption underlying ANOVA. Skewed residuals or heavy tails suggest non-normal measurement error, which can distort variance-component estimates. When data are clearly non-normal, consider a transformation or consult a statistician before reporting %GRR.
For formal reports, generate plots in Minitab or equivalent statistical software and export them as static images for the PDF. Interactive plots are useful during analysis but do not belong in an audit-ready document. Annotate each plot with the study date, gage ID, and operator codes so the report is self-contained.
Mapping corrective actions to the root cause of measurement error
Knowing whether repeatability or reproducibility is the dominant problem determines which corrective action will actually work. Fixing training when the gage is worn wastes time.
Repeatability-rooted causes and fixes:
- Worn gage contacts or probe tips: schedule calibration and replace worn components
- Inadequate fixture or part seating: redesign the fixture to constrain part orientation
- Environmental drift (temperature, vibration): establish environmental controls or move the measurement station
- Gage resolution insufficient for the tolerance: upgrade to a higher-resolution instrument
Reproducibility-rooted causes and fixes:
- Inconsistent measurement technique across operators: write explicit, step-by-step measurement procedures with photographs
- Inadequate training: conduct structured measurement training with a competency check before the next study
- Ambiguous datum or reference point: clarify the measurement setup in the work instruction with annotated diagrams
Interaction and part-selection causes:
- Operators applying different approaches to different part geometries: redesign the measurement procedure to specify technique for each geometry type
- Non-representative part sample: re-select parts to span the full process range before re-running
Pro Tip: Use a Pareto approach. Calculate the percentage contribution of each variance component, fix the largest contributor first, and re-run a focused mini-study to confirm improvement before committing to a full re-study. This saves production time and gives you documented evidence of corrective action effectiveness.
Worked example: crossed Gage R&R with ANOVA
Study setup: 10 parts × 3 operators × 3 trials = 90 total readings. Parts were selected to span the full process range. Operators were blinded to each other's results and measured parts in randomized order.
Compact data layout:
| Source | SS | df | MS | F | p-value |
|---|---|---|---|---|---|
| Parts | — | 9 | — | — | — |
| Operators | — | 2 | — | — | 0.002 |
| Operator × Part | — | — | 0.0048 | — | 0.041 |
| Repeatability (Error) | — | — | 0.0027 |
Reading the table: The significant p-value for Operators (0.002) confirms reproducibility contributes real variation. The significant Operator × Part interaction (0.041) means operator bias is not constant across parts. In A&R analysis, this interaction would have been absorbed into the reproducibility term and gone undetected.
Variance-component extraction and %GRR calculation:
From the MS column, variance components are extracted as follows. Repeatability variance (σ²_repeat) equals the Error MS directly: 0.0027. Reproducibility and interaction components require back-calculation from the expected mean squares. After extraction, total GRR variance (σ²_GRR) is the sum of repeatability, reproducibility, and interaction components.
Example calculation: If σ²_GRR = 0.0048 and σ²_Total = 0.0468, then %Contribution = (0.0048 / 0.0468) × 100 = 10.3%, and %GRR = √(0.0048 / 0.0468) × 100 = 32.0%. NDC = 1.41 × (σ_Part / σ_GRR) = 1.41 × (0.202 / 0.069) ≈ 4.1, which falls below the AIAG minimum of 5.
This result is marginal to unacceptable. The significant interaction and NDC below 5 indicate the measurement system cannot reliably distinguish process categories for SPC, even though the raw %GRR sits near the 30% threshold.
Common pitfalls when reading software output:
- Negative variance components: Software occasionally produces a negative estimate for a small variance component. Replace it with zero; do not report a negative variance.
- Interaction merging: Some software automatically pools the interaction term into error when the interaction p-value exceeds 0.25. Check whether your software did this before interpreting the ANOVA table.
- Verify in a second tool: For critical reporting, cross-check ANOVA results in a second tool or against manual formulas. Software defaults differ, and a discrepancy usually points to a setting difference worth understanding.
What to include in a Gage R&R report and when to re-run
An audit-ready GRR report is a time-stamped evidence package, not just a summary table. Include the following as a minimum:
- Study objective: Why the study was conducted (new gage, process change, PPAP requirement, etc.)
- Design summary: Number of parts, operators, and trials; randomization method; gage ID and calibration status
- Raw data snapshot: All individual readings in a table, not just averages
- ANOVA or A&R output: Full table with SS, df, MS, F, and p-values (ANOVA) or range calculations (A&R)
- %GRR, %Contribution, and NDC: With explicit comparison to acceptance thresholds
- Decision and recommended actions: Pass/marginal/fail verdict, with corrective actions assigned to owners and target dates
- Plots: All standard GRR graphics, annotated with study metadata
- Signatures and date: Approving engineer and quality manager, with study date
Attach a short narrative that maps each plot to the corrective action it supports. An auditor should be able to follow the logic from raw data to decision without asking questions.
Re-run triggers: GRR results are time-stamped evidence, not permanent certification. Re-validate after meaningful changes: major tooling or gage replacement, operator turnover, process drift detected in SPC, or as part of an annual MSA cadence. For supplier quality programs, require GRR documentation at qualification and re-qualification milestones.
Key Takeaways
A valid Gage R&R study requires representative parts, at least three operators, three trials per part, ANOVA analysis for formal reporting, and corrective actions mapped to whether repeatability or reproducibility is the dominant error source.
| Point | Details |
|---|---|
| Acceptance thresholds | Under 10% GRR is acceptable; 10–30% is marginal. Evaluate based on application criticality and plan improvements; over 30% is unacceptable and requires corrective action before use. |
| Study design | Use 10 parts spanning full process variation, 3 operators, and 3 trials (90 readings) for a standard crossed study. |
| ANOVA vs. A&R | ANOVA is preferred for formal studies because it isolates the operator×part interaction that A&R cannot detect. |
| NDC alongside %GRR | Always check NDC; a result below 5 means insufficient resolution for SPC, even when %GRR appears acceptable. |
| QA-Report integration | QA-Report's CMM data import and automated reporting features reduce manual data entry and generate audit-ready GRR documentation for ISO 9001 and AS9100 programs. |
The part of Gage R&R that most engineers underestimate
Most quality engineers understand the math of a GRR study well enough. What gets underestimated, consistently, is how much the study design itself determines the outcome before a single measurement is taken.
Part selection is the variable that matters most and gets the least attention. Engineers often pull conforming parts from the shelf because they are available, then wonder why %GRR looks suspiciously low. A study built on parts clustered near nominal will always understate measurement-system error. The math is not wrong; the inputs are. Validate part representativeness before running the full study. A quick check of the parts' measured values against the historical process distribution takes fifteen minutes and can save you from reporting a false pass.
The second underestimated factor is the pilot run. Running a mini-study first, before committing operators and production time to a full 90-reading study, surfaces fixture problems, operator confusion, and environmental issues that would otherwise corrupt the formal data. Treat the mini-study as a rehearsal, not a shortcut.
One more caution worth stating plainly: a single good GRR result is not a permanent credential. Measurement systems drift. Operators change. Fixtures wear. The Quality Magazine guidance on treating GRR results as time-stamped evidence is correct and worth taking seriously. Build re-validation into your MSA calendar rather than waiting for a customer complaint to prompt it.
QA-Report brings structure to your GRR data collection and reporting
Running a Gage R&R study generates a significant volume of raw data, plots, and documentation that needs to be organized, traceable, and audit-ready. Manual spreadsheet workflows introduce transcription errors and make re-runs after corrective actions harder than they should be.

QA-Report's CMM data import and automated reporting features address exactly this problem. Raw measurement readings import directly from CMM output, eliminating manual entry. The platform links measured values to ballooned drawing dimensions, auto-flags out-of-tolerance deviations, and generates professional PDF reports that satisfy ISO 9001 and AS9100 documentation requirements. When you re-run a study after a corrective action, the previous study remains on record for side-by-side comparison, giving auditors the traceability chain they expect.
For teams managing multiple gages, operators, and part families across shifts, the centralized platform keeps every study version, signature, and plot in one place with role-based access. Start with a free trial at QA-Report to see how automated data capture and report generation fit your current MSA workflow.
Authoritative references and further reading
The sources below represent the primary standards, practical walkthroughs, and statistical references for GRR studies. Standards and official guidance are listed first.
- AIAG Measurement Systems Analysis (MSA) Manual: The definitive reference for GRR study design, analysis methods, acceptance criteria, and reporting requirements in automotive and adjacent industries. Available through AIAG directly.
- ASQ GRR Resource Page: ASQ's quality glossary definition and curated reading list, including links to Journal of Quality Technology articles on destructive testing alternatives and attribute GRR case studies.
- Acceptance Criteria for Measurement Systems Analysis (SPC for Excel PDF): Concise reference document for the 10%/30% thresholds and their basis in AIAG guidance.
- Minitab Crossed Gage R&R Example: Practical walkthrough of a standard crossed study design and Minitab output interpretation. Useful for verifying software settings.
- Real Statistics Gage R&R (Excel): Step-by-step two-factor ANOVA implementation with explicit variance-component formulas. The best reference for engineers who need to verify calculations outside of dedicated MSA software.
- Statistics By Jim: Gage R&R Overview: Plain-language explanation of %GRR and %Contribution with practical interpretation guidance. Recommended for communicating results to non-statisticians.
- iSixSigma: Mastering Gage R&R: Study planning checklists, design choices, and common pitfalls. Practical companion to the AIAG manual.
- Quality Magazine: Making Sense of Gage R&R Analysis: Practitioner-focused article on interpreting results in context and the importance of re-validation after process changes.
- Tolerance calculation reference (Availzye Machinist Pro): Useful companion tool for calculating %GRR relative to process tolerances and verifying acceptance criteria against part-specific tolerance bands.