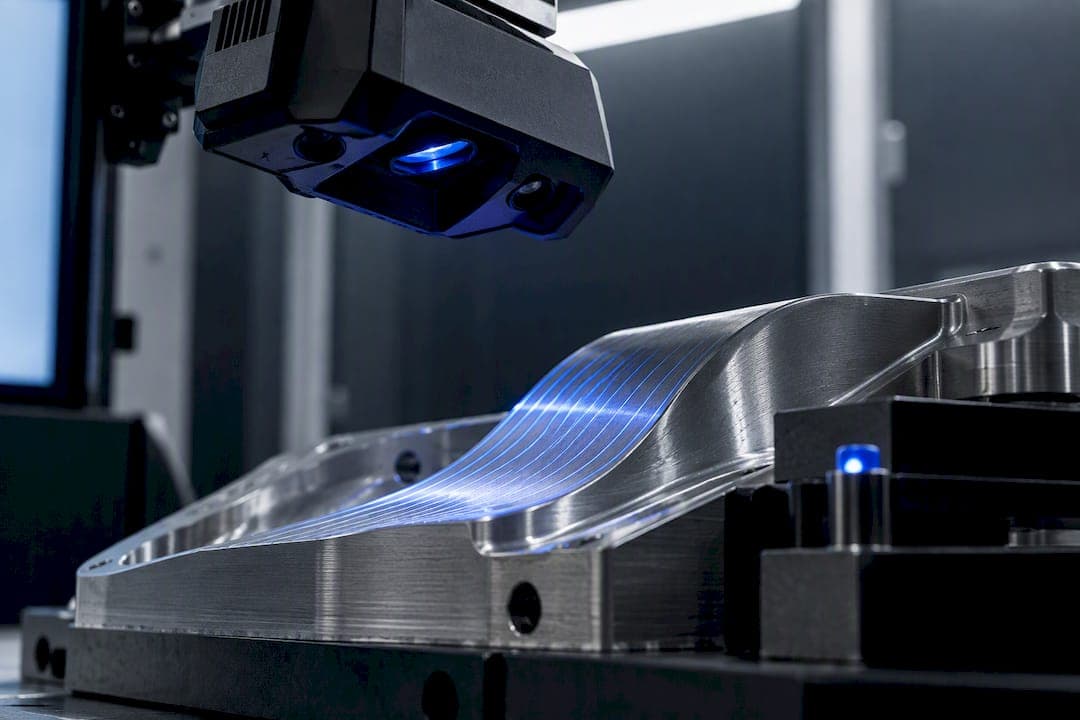
Profile tolerance confines every point of a contour to a bounded zone around the nominal surface, and profile of a surface controls the entire 3D face while profile of a line controls individual 2D cross-sections. Before you measure anything, confirm the callout type, note any referenced datums, and choose a measurement method that matches the tolerance width and part geometry.
TL;DR:
- Profile of a surface controls the entire 3D face within a bounded tolerance zone, while profile of a line applies only to specific cross-sections.
- Properly interpreting the tolerance zone width, datum references, and modifiers is crucial to avoid passing nonconforming parts or misjudging form, location, or orientation.
- Selecting the measurement method depends on tolerance size, part complexity, and surface finish, with CMMs providing the highest accuracy and optical scanning suited for complex contours.
- Measurement uncertainty and guard bands must be accounted for to prevent false rejects or accepts, especially when gaging ratios are not paired with an explicit uncertainty analysis.
- Preparing accurate, audit-ready reports involves careful fixture setup, appropriate sampling, documented uncertainty, and detailed deviation mapping.
Table of Contents
- Profile of a surface versus profile of a line
- Tolerance zone geometry, datums, and modifiers to check first
- Inspection methods: CMM, optical scanning, and stylus checks
- Measurement uncertainty, gaging ratios, and guard bands
- Practical inspection checklist for profile tolerance
- Reading deviation charts for an audit-ready report
- What experience on the floor teaches about profile inspection
- Turning profile inspection data into audit-ready reports faster
- Sources
- FAQ
Profile of a surface versus profile of a line
The distinction between these two profile controls changes what your measurement plan actually verifies. Profile of a surface establishes a 3D tolerance zone bounded by two surfaces offset from the true profile, and it controls the entire contoured face at once. Profile of a line, by contrast, defines a 2D zone that applies only to individual cross-sections, so a part can pass a line profile check while a different cross-section elsewhere on the same face fails, according to ASME Y14.5.
You will see profile of a surface most often on molded housings, turbine blades, and airfoils, where the whole face matters for fit or aerodynamic performance. Profile of a line shows up on cams and gear tooth profiles, where a specific cross-section defines function.
Two errors show up repeatedly on the shop floor:
- Assuming a line profile callout controls the entire surface when it only governs the sampled cross-sections.
- Forgetting that a profile tolerance with no datum reference is a form-only control, meaning it checks shape but not location or orientation relative to the rest of the part.
Our surface profile tolerance guide walks through additional drawing examples if the callout on your print looks unfamiliar.
Tolerance zone geometry, datums, and modifiers to check first
Read the feature control frame before you touch the part. A profile tolerance value of 0.2 millimeters typically means the total zone width is 0.2, disposed as ±0.1 on each side of the true profile unless the drawing specifies unequal or unilateral disposition. Getting this backward, treating 0.2 as the per-side value, doubles your effective tolerance and can pass a nonconforming part.

Datum references are what turn a simple shape check into a location and orientation check. A profile callout with no datums controls form only: it verifies the contour's shape but says nothing about where that shape sits relative to the rest of the part. Add datum A, and the profile gains orientation control. Add datums A, B, and C, and it now controls location as well, tying the contour to the part's coordinate system.
A few other drawing features change how you inspect:
- Composite profile tolerancing applies two tolerance zones from one symbol: a looser zone controlling location and a tighter zone controlling form.
- Boundary modifiers or unequally disposed profile callouts shift the zone entirely to one side of the nominal surface, which changes your pass/fail math.
- A quick review of the feature control frame and datum reference frame before programming prevents most setup errors.
Inspection methods: CMM, optical scanning, and stylus checks
Choosing the right measurement method depends on tolerance width, part volume, and surface finish, not habit. Each approach has a distinct accuracy profile and a distinct failure mode.
CMM (coordinate measuring machine) inspection delivers the tightest accuracy available on the shop floor, with some systems capable of roughly ±0.0001 inch, according to gear profile inspection guidance. Getting that accuracy in practice requires disciplined datum alignment before the run starts, a probe path planned to avoid interference on undercuts, and enough point density to capture local deviations rather than average them away. Probe tip diameter and the machine's maximum permissible error both affect what tolerance width is realistically verifiable.
Optical and structured-light scanning captures far more points per second than a touch probe, which makes it well suited to complex contours like airfoils or molded housings. The tradeoff is lower nominal accuracy, often in the range of ±0.0005 inch or wider depending on the system, and sensitivity to surface finish: reflective or dark surfaces can scatter or absorb the projected pattern and introduce noise. Scans also need post-processing registration to align the point cloud to the CAD nominal before deviation can be calculated.
Stylus and mechanical gauges, including dedicated digital calipers and go/no-go fixtures, remain the fastest option for high-volume production. They confirm a part is within tolerance at specific check points but offer no coverage of the full contour, so they cannot substitute for CMM or scan data during first article inspection.
- First article and design verification: CMM or optical scanning, chosen by tolerance width and surface complexity.
- Production sampling on tight tolerances: structured light for speed with periodic CMM correlation.
- High-volume, looser-tolerance production: stylus checks or dedicated gauges for throughput.
Pro Tip: Correlate your optical scanner against CMM results on a sample of parts before trusting scan data for tolerance sign-off, since finish and geometry can shift scanner accuracy in ways a single calibration certificate won't catch.
Measurement uncertainty, gaging ratios, and guard bands
A measurement result without an uncertainty estimate is an incomplete result. Metrology practice historically leaned on a 10:1 gaging ratio (the tolerance should be ten times the instrument's resolution), later relaxed to 4:1 as tolerances tightened and that ratio became harder to achieve. According to NIST guidance on measurement uncertainty, applying a simple gaging ratio without an explicit uncertainty analysis can still produce false accepts or false rejects, because the ratio alone does not account for the specific instrument's error budget or the environment it operates in.
A measurement is only as trustworthy as the uncertainty behind it: NIST's analysis shows that gaging ratios like 4:1 need explicit guard bands to keep false-accept and false-reject rates under control near the tolerance limit.
Practical steps for your inspection report:
- Calculate the instrument's expanded uncertainty and add environmental effects (temperature, vibration, fixture repeatability) before comparing results to tolerance limits.
- Apply a guard band by shrinking the acceptance zone inward from the tolerance limit by the expanded uncertainty, so borderline parts get flagged for review rather than an automatic pass.
- Document the uncertainty budget and guard band method alongside the measured values in the final report.
Practical inspection checklist for profile tolerance
A profile tolerance inspection breaks into five sequential stages, and skipping the order invites rework.
- Drawing review. Identify the profile symbol, note which datums are referenced, record the tolerance value, and confirm the disposition (equal, unequal, or unilateral).
- Fixture and environment prep. Allow thermal stabilization, seat the part on its referenced datums, and verify the fixture itself matches the drawing's datum scheme rather than a convenient clamping point.
- Measurement programming. Set a sampling density appropriate to the feature's curvature and choose a fitting algorithm; least-squares best-fit is common in CMM software by default, but minimum-zone (min-max) fitting better reflects functional assembly requirements on tight tolerances.
- Data analysis and pass/fail. Overlay measured points against the CAD nominal, generate a deviation map, apply the guard band, and make the accept or reject call.
- Reporting. Record measurement uncertainty, the sampling strategy, the algorithm used, and attach the CAD overlay image alongside the raw point data.
Pro Tip: Mismatched fixture datums are one of the most common sources of false rejects; check that your fixture's locating scheme matches the drawing's datum reference frame before you start programming, not after the first bad result.
Reading deviation charts for an audit-ready report
A deviation map plots the measured trace against the nominal CAD profile with the tolerance band shown as upper and lower boundaries, and the shape of the deviation often points straight to a root cause. A localized bump usually traces back to tooling wear or a local finish defect. A gradual slope across the trace often signals a datum or fixture shift rather than a true part defect. A uniform offset across the entire profile, with the shape otherwise conforming, typically points to datum seating error rather than a manufacturing problem with the contour itself.
An audit-ready report needs a specific set of elements, not just a pass or fail stamp:
- The measurement method and equipment used, including calibration status.
- The sampling strategy and point density applied to the feature.
- The fitting algorithm (least-squares or minimum-zone) and the stated measurement uncertainty.
- The raw measurement data attached alongside the CAD overlay image.
Case studies on profile tolerancing's inspection benefits show that a single, well-documented profile callout can replace many individual linear dimensions, which cuts both interpretation time and the number of places an inspection report can go wrong.
What experience on the floor teaches about profile inspection
The pitfalls that cost the most time are rarely the tolerance math. They are mis-specified datums that do not match how the part is actually fixtured, a scanner correlation that was never checked against CMM data, and a least-squares fit reported when the assembly actually needed a minimum-zone result. Centralized CMM data import and automatic CAD overlays remove a layer of manual transcription where these errors creep in, cutting the time between a measurement run and a documented decision.
— Michael Chen
Turning profile inspection data into audit-ready reports faster
Every step in a profile tolerance inspection, from drawing review to the final deviation report, generates paperwork that has to hold up under an ISO 9001 or AS9100 audit. QA-Report's CMM inspection software imports your CMM results directly, maps them to a ballooned drawing, and auto-flags out-of-tolerance points before you write a single line of the report.

- Automatic drawing ballooning links each dimension on the print to its measured result.
- A built-in CAD viewer overlays measured data against the nominal profile without a separate export step.
- Reports generate as audit-ready PDFs formatted for ISO 9001, AS9100, and PPAP requirements.
If your team is still assembling deviation charts and uncertainty notes by hand across separate files, start with the free plan or move straight to PRO at $149.99 per month for full measurement wizard access.
Sources
- Dimensioning and Tolerancing engineering product definition and related documentation practices (ASME Y14.5 excerpt)
- Measurement Uncertainty and Tolerance: NIST Interagency/Internal Report
- Inspection Benefits of Profile Tolerancing
- Gear tooth profile inspection (practical inspection methods and tolerances)
FAQ
How do you check profile tolerance on a part?
Review the drawing to identify the profile callout, its datum references, and the tolerance value and disposition, then measure the actual surface with a CMM, optical scanner, or stylus gauge depending on tolerance width. Compare the measured points to the nominal CAD profile using a deviation map, and apply a guard band based on your instrument's measurement uncertainty before making the accept or reject call.
What is profile tolerance in GD&T?
Profile tolerance is a geometric control that confines a contoured feature to a zone bounded by two boundaries offset from the true, nominal profile, as defined in ASME Y14.5. Profile of a surface controls the entire 3D face, while profile of a line controls individual 2D cross-sections.
What is the 3-2-1 rule in GD&T?
The 3-2-1 rule describes a datum setup method where three points on a primary datum surface establish a plane, two points on a secondary surface establish a line, and one point on a tertiary surface establishes a single location, together fixing all six degrees of freedom for measurement. It is a fixturing and alignment concept rather than part of the profile tolerance definition itself, and it matters here because a mismatched datum setup is a common cause of false profile measurement results.
What is the difference between flatness and profile tolerance?
Flatness controls a single planar surface within a tolerance zone bounded by two parallel planes and never references a datum. Profile tolerance controls a contoured or curved surface, can reference datums to add orientation and location control, and applies to shapes that flatness cannot describe at all.
Why is profile tolerance important on complex parts?
Profile tolerance lets one callout replace numerous individual linear dimensions on a contoured feature, which reduces both drawing complexity and inspection interpretation time, as shown in industry case studies. It also gives a clearer, single measurement of whether a complex shape, such as a turbine blade or molded housing, matches design intent.