
A manufacturing quality dashboard is a single, live view of inspection and production data that shows whether parts meet specification and where they do not. A good one tracks a short set of KPIs (first pass yield, defect rate, cost of poor quality, process capability), breaks defects down by type, part, process, shift and time, and routes every alert to a named owner. This guide covers what to put on it, where the data comes from, how to lay it out and how to close the loop from signal to corrective action.
TL;DR
- Track a small, balanced set of KPIs: first pass yield, defect rate, scrap and rework cost, process capability and on-time delivery. Six to eight metrics beat thirty.
- A dashboard is only as good as its source data. Inspection results, route cards, batch records and ERP data must be captured at the point of work, with part, batch, operation and operator attached.
- Design by exception: alerts at the top, trends in the middle, summary statistics and drill-down links at the bottom.
- Slice defects by type, part number, process, machine, shift and time so a Pareto view points to the real cause.
- Every alert needs an owner and a deadline. Without corrective action tracking, a dashboard only records losses.
Table of Contents
- What a quality dashboard does in a manufacturing plant
- The KPIs to put on a manufacturing quality dashboard
- Show defects by type, part, process, time and location
- Data sources and refresh frequency
- Design the layout around exceptions
- From alert to corrective action
- What a manufacturing quality dashboard looks like in practice
- Common mistakes to avoid
- How QA-Report supports your quality dashboard
- Our perspective
- FAQ
- Sources
What a quality dashboard does in a manufacturing plant
A quality dashboard pulls scrap, yield, defect and cost data from inspection systems, MES and ERP into one governed view. Simple BI describes this as a live reporting environment that tracks six to eight core KPIs, including first pass yield, defect rates and cost of poor quality.
The purpose is not decoration. It answers three questions for a quality manager every morning:
- Are we making conforming parts right now?
- If not, where is the problem: which part, process, machine or shift?
- Who is acting on it, and by when?
A dashboard that answers only the first question is a report. One that answers all three is a management tool.
It also helps to separate the dashboard from the system of record. Your inspection reports, FAI packages and measurement data are the evidence. The dashboard is the layer that summarizes that evidence and lets you drill back into it. If the dashboard cannot link to the underlying inspection record, nobody will trust the number on the screen during an audit.
The KPIs to put on a manufacturing quality dashboard
Start with balance. APQC recommends monitoring manufacturing KPIs across four categories: cost effectiveness (such as scrap and rework cost as a share of cost of goods sold), cycle time, process efficiency (OEE, first-pass quality yield, unplanned downtime) and staff productivity. A quality dashboard does not need all of these, but it should not show only one category either. A plant that tracks only defect counts can look good while cycle time and rework cost quietly climb.
A practical core set for a machine shop or regulated manufacturer:
| KPI | What it tells you | How it is calculated |
|---|---|---|
| First Pass Yield (FPY) | Share of parts that pass every check without rework | Units passing all checks without rework ÷ units started × 100 |
| DPMO | Defect density, comparable across parts of different complexity | Defects ÷ total defect opportunities × 1,000,000 |
| Cost of Poor Quality (COPQ) | Money lost to scrap, rework, returns and warranty | Sum of failure costs, often shown as a percentage of revenue |
| Cpk | Whether a process can hold a tolerance consistently | Smaller of (USL − mean) ÷ 3σ and (mean − LSL) ÷ 3σ |
| Scrap and rework rate | Where material and labor are being lost | Scrapped or reworked units ÷ units produced |
| Customer returns / escapes | Defects that reached the customer | Count or rate per shipment period |
| On-time delivery | Whether quality problems are delaying orders | Orders shipped on time ÷ orders due |
A few notes on how to read these numbers.
First pass yield
FPY is the most honest quality number on the floor, because it counts a part that needed rework as a failure even if it eventually shipped. A plant can report 99% final yield and still have a much lower FPY, with the difference hidden in rework labor. Our guide to measuring first pass yield on the shop floor walks through how to capture it without double counting.
DPMO and Six Sigma context
DPMO normalizes defects by the number of opportunities, so a simple bracket and a complex manifold can sit on the same chart. Simple BI notes that 3,400 DPMO or fewer corresponds to Six Sigma performance. Use it as a reference line on the chart, not as a target to chase blindly: the right target depends on part criticality and customer requirements.
Cost of poor quality
COPQ turns quality into the language finance understands. Simple BI cites an ASQ benchmark range of 5 to 20% of revenue for COPQ, with a goal of reducing it toward 1 to 3%. Treat those as orientation points. What matters on your dashboard is your own trend, and which category (scrap, rework, returns, warranty) is driving it.

Process capability
Cpk tells you whether a process is capable of holding tolerance, which is a leading indicator. FPY and defect counts tell you what already went wrong, while a falling Cpk warns you before parts go out of tolerance. If you report capability to customers, make sure you understand the difference between short-term and long-term indices: see Cpk vs Ppk and our walkthrough of how to run a process capability study. For a broader shortlist, 7 quality KPIs manufacturing quality managers should track covers the metrics most teams start with.
Show defects by type, part, process, time and location
A single defect-rate number cannot tell you what to fix. The dashboard needs filters and breakdowns so that one click turns "scrap is up" into "bore diameter rejects on machine 4, second shift, since Tuesday."
Build these views, in roughly this order:
- Pareto by defect type. Sort defect categories (oversize, undersize, surface finish, burrs, missing feature, wrong material) from most to least frequent. A Pareto chart is usually the fastest way to see which few causes account for most of the losses.
- Defects by part number or product family. This separates a problem with one drawing from a problem with the process.
- Defects by operation and machine. Turning, milling, deburring, plating and final inspection each leave different signatures.
- Defects by shift, operator group and batch. Patterns here point to setup practices, tooling changes, material lots or training.
- Defects over time. A run chart or control chart shows whether a problem is a spike, a drift or a step change.
- Defects by supplier or location. In multi-site or outsourced operations, compare plants and vendors on the same definitions.
The trap is inconsistent categories. If one inspector logs "out of tolerance" and another logs "oversize," the Pareto chart splits a single cause into two small bars. Agree on a short defect code list, tie each code to a characteristic on the ballooned drawing where possible, and keep the list stable.
At the characteristic level, the best defect data comes from measurement itself. When results are linked to each ballooned dimension and automatically compared with tolerance, out-of-tolerance findings are recorded as data the moment they are measured, rather than typed in later from a paper form.
Data sources and refresh frequency
A quality dashboard is only as reliable as the pipeline behind it. Plan for four kinds of input:
- Inspection and measurement data. FAI reports, in-process and final inspection results, CMM output and gauge readings. This is the core of the dashboard.
- Production context from MES. Work orders, route cards, batch and serial numbers, machine, operation and operator, so each defect has a where and a when.
- ERP data. Part masters, orders, inventory, costs and supplier information, which turn defect counts into cost and delivery impact.
- Corrective action records. Nonconformance reports, rejection and recovery records, and the status of each action.
How often should it refresh? Match the refresh to the decision. A rule of thumb many plants use, not a standard:
| View | Typical refresh | Why |
|---|---|---|
| Alerts on in-process out-of-tolerance results | Near real time, as results are saved | The operator can still adjust before more parts are cut |
| Shift and daily FPY, scrap and rework | At least per shift | Supports the shift handover and daily quality meeting |
| Capability (Cpk) and trend charts | Daily or per production run | Needs enough samples to be meaningful |
| COPQ, supplier and customer-return KPIs | Weekly or monthly | Costs and returns post later and drive management review |
The more important question is latency at capture. If inspectors fill in paper forms and someone keys them in the next morning, a real-time dashboard is only a slower report. Capturing results at the workstation, on a tablet or phone, is what makes the numbers current. Our guide to production tracking software covers the capture side, and the piece on ERP quality integration explains how to keep quality and planning data consistent, which matters as FDA's QMSR moves device makers toward a quality system aligned with ISO 13485.
Design the layout around exceptions
Most dashboards fail by showing everything. Thirty tiles in the same shade of blue make the one that matters invisible.
ProSense describes exception-based design as showing the data that needs attention rather than every metric all the time. Its suggested layout puts exceptions and alerts at the top, trend charts for key metrics in the middle, and summary statistics with links to detailed reports at the bottom. That order matches how people scan: first "is anything wrong," then "is it getting worse," then "show me the detail."
Apply it like this:
- Top band: open alerts, such as out-of-tolerance characteristics, parts on hold, overdue corrective actions. Use one alert color and use it for nothing else.
- Middle band: FPY, scrap rate and Cpk trends for the parts and lines the viewer owns. Show control limits or targets on every chart.
- Bottom band: the Pareto chart, COPQ summary and drill-down links to the inspection reports and batch records.
A few rules keep it readable:
- Give each role its own view. An operator needs today's alerts on one machine. A quality manager needs cross-line trends. An executive needs COPQ and delivery.
- Show targets and limits, not just values. A number without a reference is trivia.
- Define every KPI in one place, with the formula and data source, so the same metric means the same thing across plants.
- Keep the first screen to what fits without scrolling.
- Make every number clickable down to the underlying inspection record.
From alert to corrective action
The most common gap is the last one. A chart turns red, people notice, and then nothing is assigned. Every alert should create a record with an owner, a deadline and a status, and that record should be visible from the same screen.
A workable loop:
- Detect. An out-of-tolerance result or a KPI breach triggers an alert.
- Contain. Quarantine the suspect batch or serial range. Traceability from part to batch to operation makes this a lookup instead of a hunt.
- Investigate. Filter by part, machine, shift and time to narrow the cause. Check tooling, material lot, program revision and setup.
- Correct. Assign the action, set the due date and record the fix, including rework or recovery of rejected parts.
- Verify. Watch the same KPI after the fix. If FPY or Cpk does not recover, the action did not address the cause.
- Standardize. Update the control plan, work instruction or inspection plan so the problem does not return.
One way to test your dashboard: pick last month's biggest quality problem and trace it from first alert to verified closure. Wherever the trail goes cold, that is the gap to fix.
What a manufacturing quality dashboard looks like in practice
Public examples show the typical pattern. Floatinity describes a cloud-based production quality dashboard for an automotive component manufacturer that consolidates inspection data on one platform, with real-time visibility, configurable SPC charts, historical trends and shift-wise performance reports.
For a machine shop building aerospace, automotive or medical parts, a realistic first version might include:
- An FPY trend by part family, with a drill-down to the failing characteristics.
- A Pareto chart of out-of-tolerance dimensions across all open orders.
- Cpk for the three most critical characteristics on the top parts.
- A list of batches on hold, with age and owner.
- Open corrective actions, sorted by due date.
This is a modest set, and it is enough to change how a weekly quality meeting runs. Add views only when someone asks a question the dashboard cannot answer.
Common mistakes to avoid
- Too many KPIs. If nobody can say what action each metric triggers, remove it.
- Outcome-only metrics. Pair results like scrap rate with controllable inputs such as tool life, setup verification and first-piece approval.
- Inconsistent definitions. FPY calculated three ways across three plants cannot be compared.
- Manual data entry as the pipeline. Retyped data is late, and it carries errors into the one place people trust.
- No link to evidence. Auditors ask for the underlying record, so the dashboard must open it.
- Dashboards without owners. Name a person responsible for each KPI and each view.
How QA-Report supports your quality dashboard
We built QA-Report so that the data a dashboard depends on is captured correctly in the first place. Drawings are ballooned, measurements are linked to each ballooned dimension, out-of-tolerance deviations are flagged automatically and results feed statistical summaries and PDF reports. CMM data can be imported and mapped, and the MES layer tracks parts, batches and operations with route cards, rejection and recovery tracking and role-based shop-floor access. If you are weighing how far to go, our article on OEE first or full MES lays out the decision, and the guide to MES for machine shops shows route cards, batches and inventory in practice.
Plans are published at qa-report.com/pricing: Free at $0 per month, Basic at $49.99 per month and PRO at $149.99 per month, with On-Premise and Enterprise Solutions available for organizations that need them. Explore QA-Report's inspection and production planning platform to see how it fits your shop.
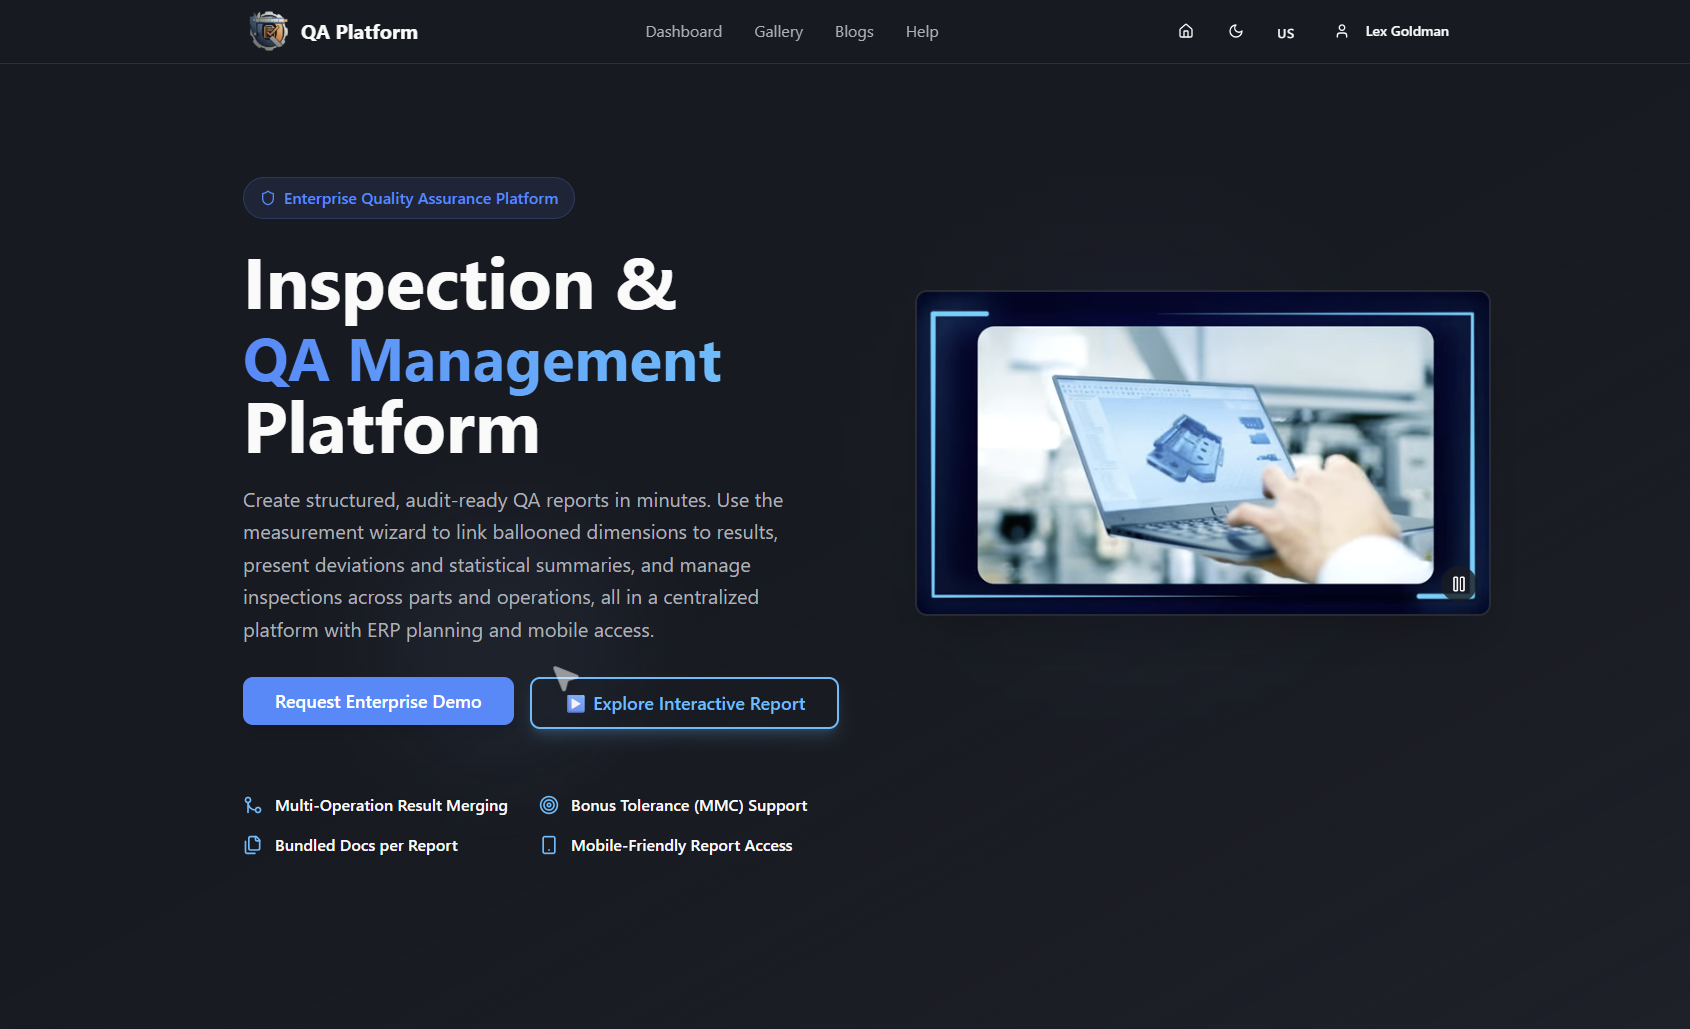
If you import data from coordinate measuring machines, see how CMM inspection software for automated reports works, or watch the tutorial video gallery for walkthroughs.
Our perspective
Most quality dashboards fail upstream of the screen. The charts are fine, but the data behind them was typed in late, categorized differently by each inspector and detached from the drawing it came from.
We start from the characteristic. When every dimension on the drawing is ballooned and every measurement is tied to it, a deviation is recorded the moment it is measured, with the part, batch and operation attached. That makes the Pareto chart, the yield trend and the capability index consequences of good capture, not a separate reporting project.
We also believe the dashboard belongs next to the work. Inspection, route cards, batch tracking, rejection and recovery, and report sharing sit on one platform, so an alert can lead to containment, investigation and corrective action without exporting a spreadsheet. For teams in sensitive industries, the option of cloud or on-premise deployment keeps that data under the controls they need.
Start small: five KPIs, one owner each, and a clear route from alert to action. Expand when the team is using what it already has.
Michael Chen
FAQ
What is a quality dashboard in manufacturing?
It is a live, consolidated view of quality data such as inspection results, yield, defects, scrap and cost of poor quality. It shows whether production is meeting specification and highlights exceptions that need action. The best ones link each figure back to the inspection record behind it.
Which KPIs should be on a manufacturing quality dashboard?
Start with first pass yield, defect rate or DPMO, scrap and rework cost, process capability (Cpk) and on-time delivery. Add cost of poor quality for management review. Keep the total to roughly six to eight so each one drives an action.
How often should a quality dashboard update?
Match the refresh to the decision. Alerts on out-of-tolerance results should appear as soon as results are saved, yield and scrap views at least every shift, and cost and customer-return metrics weekly or monthly. Capturing data at the workstation matters more than the refresh setting.
Can a small machine shop use a quality dashboard?
Yes. A small shop can begin with FPY by part, a Pareto chart of out-of-tolerance dimensions and a list of open corrective actions. Those views come directly from well-structured inspection data, and they scale as you add parts, batches and operations.
How do I connect a dashboard to corrective action?
Make every alert create a record with an owner, a due date and a status, and show open actions on the same screen. After the fix, watch the original KPI to confirm it recovered before closing the action.
Sources
- How to Build a Quality Control Dashboard in Power BI for Manufacturing (Simple BI)
- What Are Basic Strategies for Measuring Manufacturing Progress (APQC)
- Creating Effective Dashboards Using Exception-Based Design and Trend Analysis (ProSense)
- Real-Time Production Quality Dashboard (Floatinity)